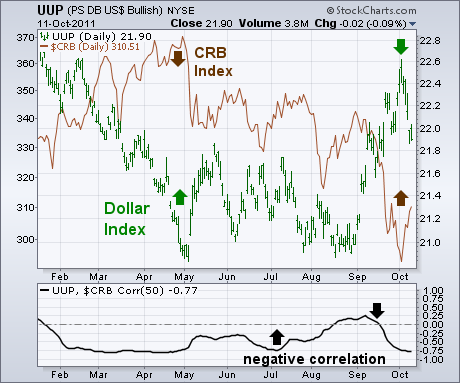
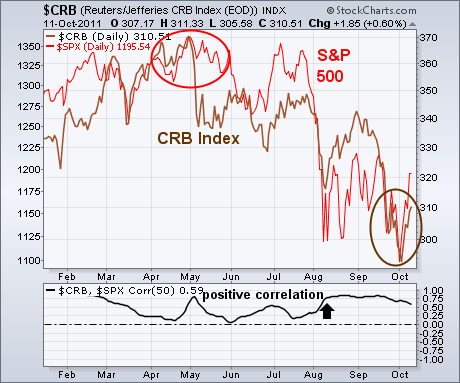
Last Thursday I showed some traditional charts that suggested stocks and commodities were due for a rally. In the case of stocks, a lot of global stock and U.S. stock indexes had reached important support at their mid-2010 lows and were in oversold territory. In addition, I suggested that the S&P 500 had completed the fifth wave in a five-wave decline. That suggested to me that the stock market may have put in an October bottom which should pave the way for a fourth quarter rebound. I also showed the CRB Index testing two important support lines going back a year. I suggested that was a logical spot for commodities to attempt a rebound which would also be good for stocks, and especially stocks tied to commodities like energy and materials. Today, I'd like to show how those traditional chart signals are supported by intermarket trends. Chart 1 shows the inverse relationship that exists between the Dollar Index (green line) and the CRB Index (brown line). The May commodity peak coincided with a dollar bottom. Over the last week, those roles reversed. A sharp drop in the dollar (prompted mainly by a surge in the Euro) gave a boost to commodity prices just as they were testing important support. The 50-day "correlation coefficient" below Chart 1 shows a negative correlation between the dollar and commodities since the start of the year (except for a brief period during August). Chart 2 shows a positive correlation between the CRB Index and the S&P 500 (red line). Both peaked together at the start of May and troughed together over the last week. Both benefited from the falling dollar.


