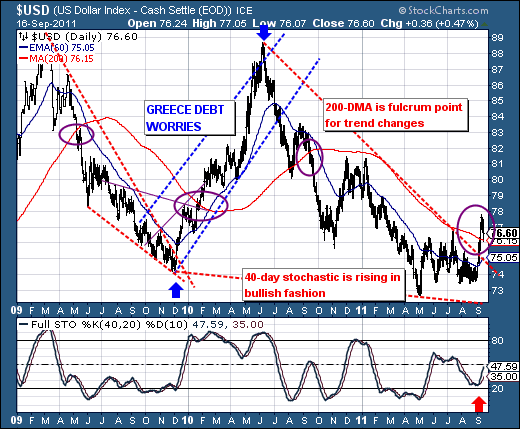
Over the past 6-weeks, we've seen the S&P 500 trade in a large sideways pattern between 1220 and 1100; we find this eerily reminiscent of a bearish pattern that will resolve itself to new lows. Certainly this is our viewpoint; and we believe the supporting technicals in the US Dollar Index ($USD)confirm our belief.

Quite simply, the USD rises when there is "stress" in the world as market participants move towards safety. Over the past year or more, USD has been in a downtrend, but that downtrend now appears to be over. Note the wide girth bullish wedge coupled with the breakout above the 200-day moving average. Our real focus is upon the 200-day, for history has shown that breakouts or breakdowns of this important, yet simple standard moving average - indicate a change in trend. This is what we see on the chart now, and thus it begs many questions?
Certainly the first should be that given the Euro is roughly 60% of the USD, then what should we make of the European debt crisis and shall it spiral out of control far worse than anyone is expecting at this point given the USD looks poised to make another run towards the 87-89 zone? Those trading USD now have the wind at that back from a technical perspective. This has negative implications for the stock market - regardless of last week's 5-day rally.
Thus, the current S&P 500 rally looks in trouble; and one must look to be aggressive in short positions.
Good luck and good trading,
Richard
