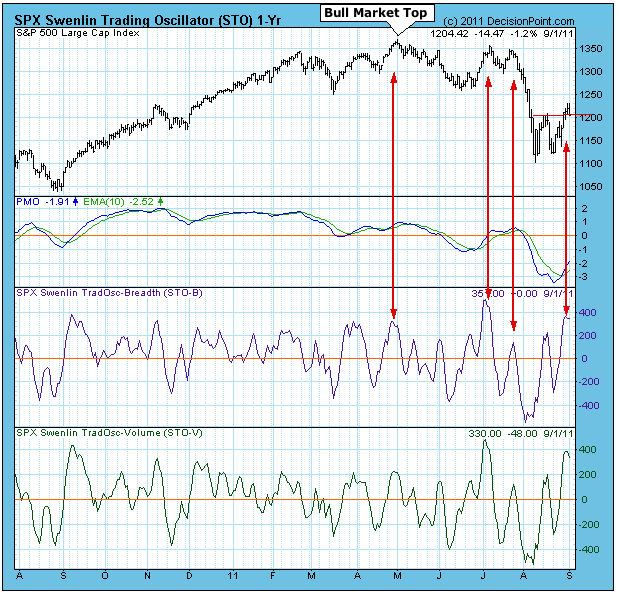
It is a concept that we stress on a periodic basis, and we got another illustration this week. Technical indicators must be interpreted within the context of the overall market trend.
On August 17 the S&P 500 Index 50-EMA crossed down through the 200-EMA, declairing by our definition that the long-term trend was down and that we were in a bear market. When this happens, we remind ourselves that "bear market rules apply," and that we should expect negative outcomes more often than positive ones.
As of yesterday many of our short-term indicators were overbought and topping -- the chart below shows what the STO-B and STO-V looked like yesterday. And even though prices had broken above the previous August top, we expressed doubts about the viability of the rally in our daily blog because internals were negative.
While we just recently had technical confirmation that we are in a bear market, the bear has actually been around since the May 2 top, and the coincidence of price and indicator tops was an early clue that the up trend had stalled and may have been in trouble. Since the price break in August we need to consider overbought indicator tops as being cracks in thin ice.
- Carl

