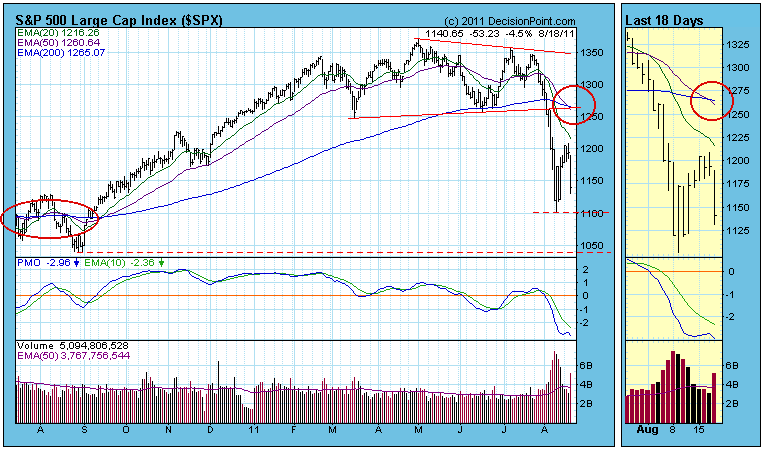
On 8/2/2011 our mechanical Thrust/Trend Model generated a medium-term NEUTRAL signal for the S&P 500 Index just in time to avoid the market break on 8/4. (Neutral means to be market neutral -- in cash or fully hedged.) After the breakdown we believed we had entered a bear market, but we had to wait for the long-term component of the Trend Model to generate a mechanical SELL signal to make it "official", which it did as of 8/17/2011.
A long-term sell signal is generated when the 50-EMA of a price index crosses down through the 200-EMA (generally known as the Death Cross). At Decision Point we don't consider the long-term sell signal to be a demand for action. Rather it is a flag that says, "Hey, folks, we're in a bear market now. Act accordingly."
Below is a daily bar chart of the S&P 500 with the recent crossover circled on the right. Just to show that it is not a perfect indicator, I have also annotated on the left two 50/200-EMA crossovers that occured in August and September of last year, both of which were bad signals.
Am I concerned that this latest signal will be wrong? Not really. Its value is primarily in that it tells us to adjust our expectations from bullish to bearish. In a bull market it is best to stay positive and expect bullish outcomes, even during corrections. In a bear market, if we expect negative resolutions, we will be right most of the time.
It is a long-term sell signal, but it doesn't mean to go 100% short on the day of the signal, rather we should look for short- and medium-term opportunities to go short to develop. This is where we have a margin of safety when working with these long-term signals -- we look for opportunities. If we don't find many, our exposure will be limited.
Reviewing major market indexes I see that we have long-term sell signals on The S&P 500, S&P 100, NYSE Composite, Russell 2000, Wilshire 5000, S&P 400, and S&P 600. We are still waiting for the Dow, Nasdaq, and Nasdaq 100 indexes, but their prices are well below their 50-EMA and 200-EMA, which means sell signals are virtually inevitable.
A recent CNBC article urges: "Don't Fear the 'Death Cross' in This Fast-Moving Market". In other words, keep right on thinking like a bull. That's just silly. We have objective evidence that the market has entered a bear phase, so we should take that evidence at face value until the evidence changes. The fact that we ahd two bad signals in 2010 is no reason to ignore the current signal because the model has a pretty good record over time. In 2010 Timer Digest ranked Decision Point #4 for Long-Term timing over a 10-year period, with a gain of +77.64% versus a loss of -4.74 for the S&P 500. (Past performance does not guarantee future results.)
Bottom Line: Long-term SELL signals abound on the major stock indexes, which means we are by our definition in a bear market. It is now time to pass our analysis through a bearish screen, to assume that most surprises will be to the downside, and to look for opportunities to sell short. This is a perfect example of technical analysis being a wind sock, and we have no choice but to plan our approach accordingly. If the wind changes, we will adjust.

