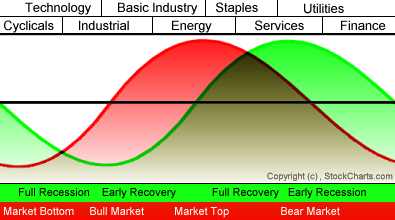
My Tuesday message talked about how sectors rotate near market tops. I explained that market leadership by materials and energy (which carries inflationary expectations) is often a sign of market that's in need of a correction or a consolidation. I also explained that money coming out of those two leading sectors usually rotates into defensive sectors like consumer staples and healthcare. Chart 1 is a visual representation of how that happens. The red line plots the stock market while the green line tracks the economy. Our main interest here is with sectors which are plotted along the top of the chart. You can see that Basic Industry (materials) and Energy are late cycle leaders. Tops in those two groups usually coincide with the start of a market correction or consolidation. When that happens, leadership swings to Staples and Services. [The Model is based on the work of Sam Stovall of Standard & Poors. In my 2009 book, The Visual Investor (Second Edition, p. 208), however, I changed Services to Healthcare which makes more sense]. As I explained on Tuesday, materials and energy were the two top sectors entering the month of April. Over the last week, energy and materials have reversed to the two weakest sectors. Right on cue, staples and healthcare have reversed to the two strongest. That doesn't necessarily mean that a major top is forming. It does suggest, however, that market sentiment has turned more defensive which usually suggests a market correction or a period of consolidation.

