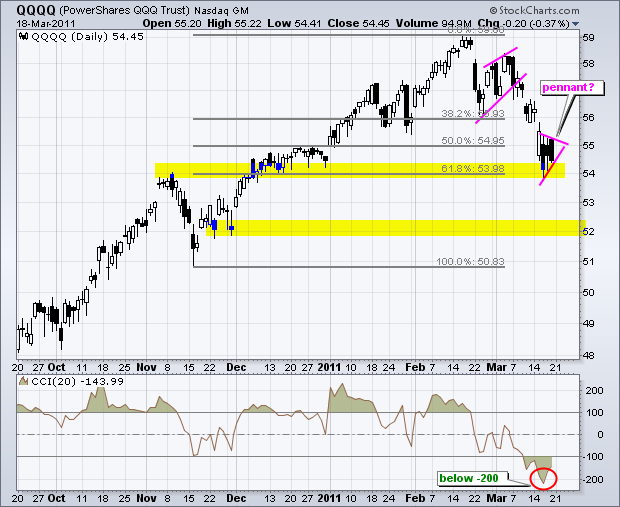
With big declines on Wednesday, the Nasdaq 100 ETF (QQQQ) and the Russell 2000 ETF (IWM) both became oversold and hit potential support zones. The first chart shows QQQQ hitting support around 54 after an 8+ percent decline the last few weeks. This decline pushed the Commodity Channel Index (CCI) below -200 for the first time since early May, seen of the infamous flash-crash. Broken resistance, the December consolidation and the 62% retracement combine to mark support here. The ETF consolidated the last three days with a small pennant taking shape. A break, up or down, from this consolidation will provide the next short-term directional clue.

Click this image for a live chart
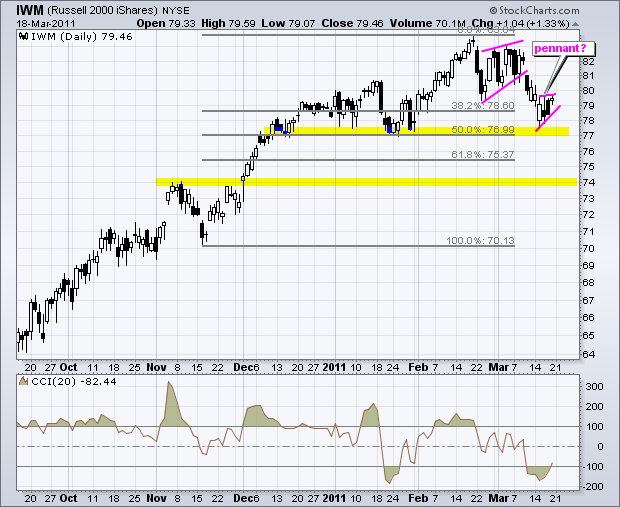
The next chart shows IWM hitting support just above 77. This support zone stems from the January lows and the 50% retracement mark. Notice that IWM held up much better than QQQQ over the last few weeks. CCI moved well below -100, but did not exceed its January momentum low and did not exceed -200. A small pennant also formed the last three days. A move above 80 would put the bulls back in play, but a break below 78 would argue for a continuation lower with the next support target around 74.

Click this image for a live chart
