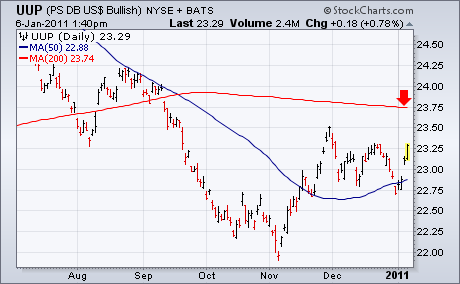
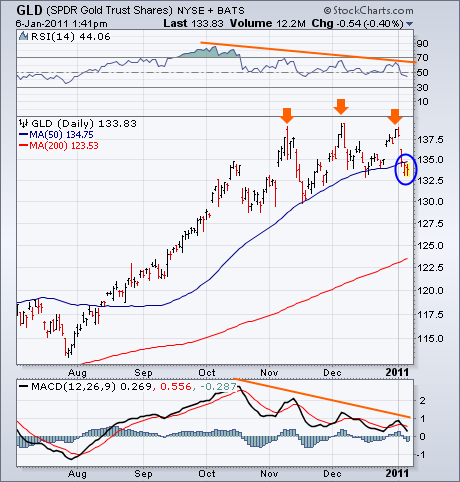
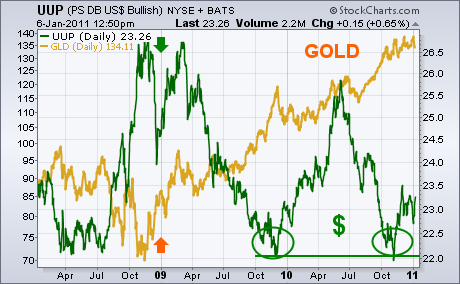
Tuesday's message wrote about an overbought condition in stocks and commodities, and showed gold in particular starting to roll over to the downside. Although some have questioned the viability of the dollar/commodity link, my view is that it's alive and well. Intermarket relationships aren't perfect and do get out of line on occasion. My experience, however, it that sooner or later they snap back into place. This may one of those times. Chart 1 shows the PS Dollar Bullish ETF (UUP) bouncing sharply this week (after bottoming in November). Gold is the market most sensitive to dollar moves. And, not surprisingly, gold is the market being most negatively impacted. Chart 2 shows the Gold Trust Shares (GLD) slipping below its 50-day average for the first time since August. The price pattern has the look of a "triple top" formation (marked by three peaks). Notice that the first peak took place in early November when the dollar bottomed. Notice also that the daily RSI (top of chart) and MACD lines (bottom) have been descending since October. That shows loss of upside momentum. Chart 1 also shows that the UUP is still well below its 200-day moving average. A move up to retest that major resistance line (or its late November peak) will help determine if this is just a bear market bounce in the greenback or something more lasting. That upside test may coincide with stocks and commodities testing some underlying support levels. At this point, however, I'm inclined to view all of these intermarket trends as retracements of current trends and not necessarily major reversals.


