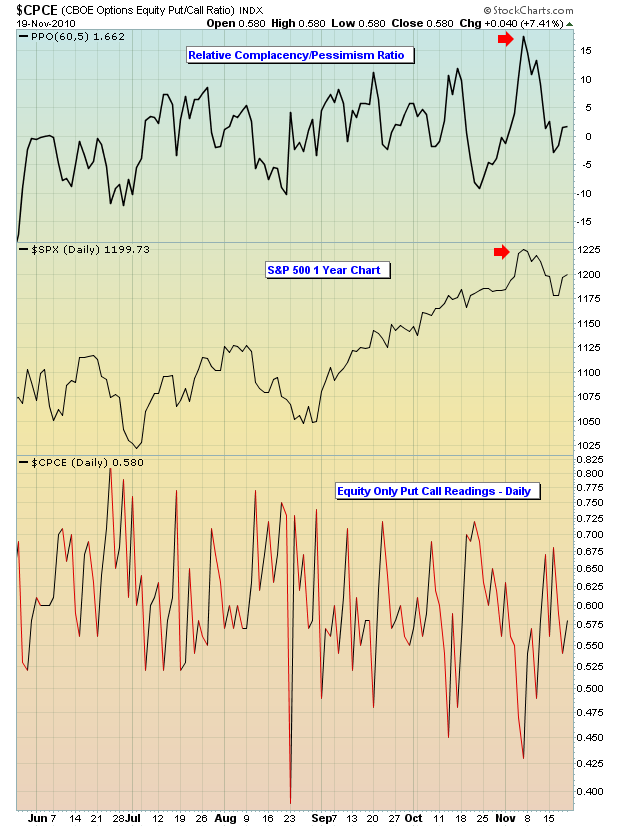
The top in April was laced with warning signs, from record complacency to negative divergences on daily and weekly MACDs to underperforming financials to overbought oscillators to oversold bonds. In particular, the negative divergence on the MACD on the weekly charts suggested the weakness was likely to last. Recently, complacency once again became an issue. As expected, the market reversed lower. Check out the chart below:

In my long-term analysis of the market and the history of market tops, high complacency is definitely a contributing factor. The extent of any subsequent weakness, however, generally lies within the number of corroborating technical signals that are bearish. As mentioned above, the weekly divergences in April were abysmal and clearly negative, suggesting many weeks or months of market turmoil. I anticipated the summer to be sideways to outright bearish given those divergences. However, once the divergences on the MACD "reset" back to the centerline, the market was able to regain its earlier bullish momentum, which is exactly what we saw in September and October.
So what impact might the recent complacency and overbought conditions have on the market as we move forward? Well, that's the subject of our Chart of the Day for Monday, November 22, 2010. At the time of this article, I am literally returning from the Las Vegas traders expo and, as a result, the Chart of the Day will be updated as soon as I'm grounded back on the East Coast. CLICK HERE for more information.
Happy trading!
