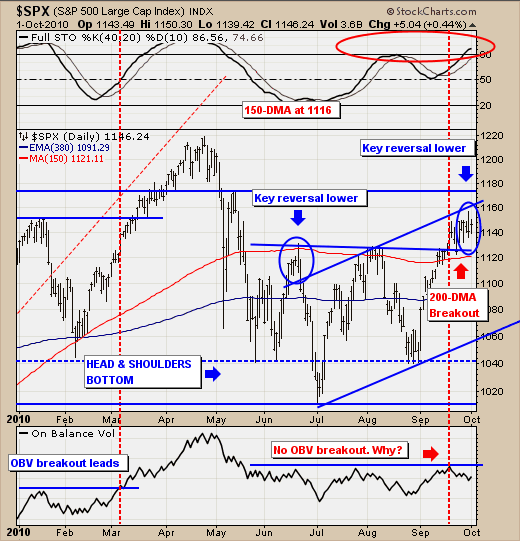
Given this non-confirmation, then we would turn to the developing bearish consolidation from May-to-Present as the overarching technical pattern, then point out the recent key reversal pattern to the downside that denotes exhaustion of the current uptrend. If we are right, then we'll get a minimum correction towards rising trendline support at 1060. However, we would further view this as doing excessive technical damage given the invalidation of the 200-day moving average and "head & shoulder" neckline breakouts. This would increase the probability of the bearish consolidation projecting lower lows towards 950. Moreover, were weakness were to develop from current as expected; it would turn the 40-day stochastic lower...further confirming weakness.
The S&P 500 rally off the late-August lows continues apace, although it would appear that it is stalling and a correction at a minimum is warranted. There are many who point to the 200-day moving average breakout and the "head & shoulders" neckline being pierced to the upside as being sufficient to call for higher and higher targets - a new bull market in full bloom. However, while these are major technical pattern breakouts to be sure, but they come under less-than-ideal circumstances as they haven't been confirmed by the OBV "on-balance-volume". We would look to this indicator for confirmation of the breakout, for OBV did indeed lead the S&P higher with its early-March breakout. It has not thus far, and we find this troubling.
