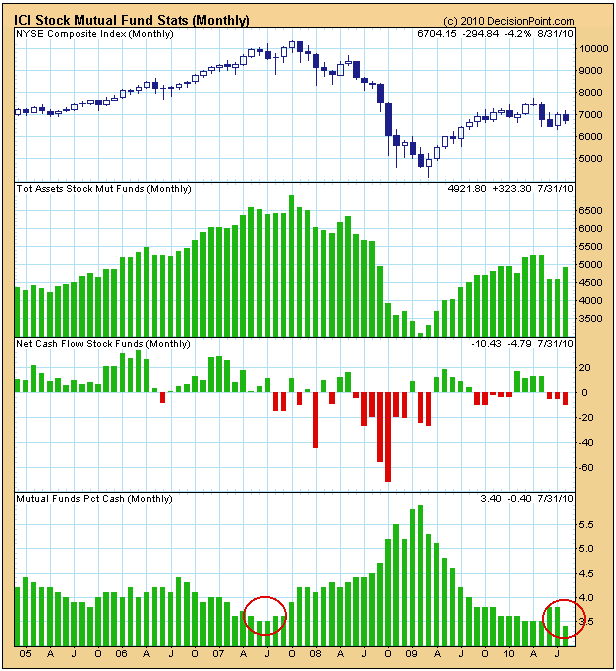
The Investment Company Institute (ici.org) compiles statistics on mutual funds and publishes them monthly. (There is a one month delay between the end of the month being reported and publication.) Decision Point has been collecting these data for almost five years, and we finally have enough to start charting it. Amounts shown on the charts are in billions.
The bottom panel on the first chart shows the percentage of of mutual fund assets held in cash. A low percentage of cash indicates that fund managers are bullish on stocks and do not believe they will need much cash to meet redemptions, as would be the case if stock prices were to fall. The current percentage (3.4%) is lower than what it was near the top of the last bull market. I would consider that to be bearish for stocks.
The next chart shows assets in money market funds. What stands out to me is that, while money market assets have declined since the 2009 market bottom, they have not dropped to the levels seen during the bull market in 2005 and 2006. I interpret this as evidence of investors' reluctance to make a robust commitment to stocks, in spite of a substantial advance from the bear market lows.
Bottom Line: We seem to be getting mixed signals from the mutual fund assets data. The low percentage of cash held by fund managers is bearish for stocks; whereas, the level of money market fund assets shows plenty of cash on the sidelines which could be used to feed a substantial advance in stocks. On the other hand, perhaps the relatively high money market levels indicate that investors have reached their maximum tolerance level for risk in stocks and that they will not be committing any more money to the stock market. I am not sure if this is the correct interpretation, but it would seem to be confirmed by the consistently low volume the market has experienced during the advance from the 2009 lows.


