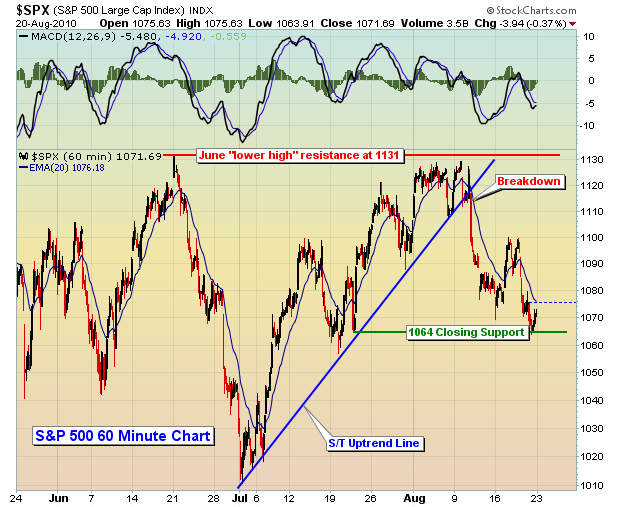
Technically, the S&P 500 confirmed the end of its short-term uptrend on August 11th. In my article on August 7th, I suggested that the short-term uptrend on the S&P 500 be watched carefully for short-term directional clues. The uptrend was on a course for a major battle at 1131 resistance and the winner of that battle would have the upper hand in terms of short-term market direction. Take a look at how that trend resolved itself:

The bulls simply didn't have enough gas in the tank. Not enough key influential sectors/industries participated in the breakout attempt. It was doomed from the beginning. The bears understand where the MAJOR resistance lies - at 1131. So now the question becomes, how low do we go? Technically, I've identified two key areas of support. The first was the July 16th close at 1064.88, while the second resides all the way back down at the July 2nd close at 1022.58. Obviously, a close beneath 1022.58 spells more trouble ahead. That's the last thing this market needs as we head into the worst historical month of the year - September.
I continue to lean to the bearish side, but I don't believe we're heading back to test 666 like many in the bearish camp. The market has a way of overdoing things during panicked times and that low came on the heels of monumental levels of panic. We'd have to see a lot more economic and technical deterioration before we'd come close to revisiting those levels. Personally, I believe a move on the S&P 500 to 950 might just do the trick, although I'll certainly keep my options open. Such a move during the historically weak month of September would make a lot of sense, both technically and fundamentally. It's a really tough and volatile market though. There are so many bullish and bearish arguments, trying to decipher which ones make the most sense is next to impossible. But I always keep one thing in mind. The market uses every bit of known information to come up with current prices. Don't believe for a minute that you have knowledge that the market hasn't considered. There's a reason it's priced where it is. So I always leave the door open on both sides - bullish and bearish.
One of my favorite relative charts is included as our Chart of the Day for Monday, August 23, 2010. The recent uptrend in this chart portends of further market weakness. CLICK HERE for details.
On Tuesday, August 24, 2010, we will be hosting the 5th monthly event in our very popular Online Traders Series. This month's event will delve into the Elliott Wave Theory, a form of technical analysis that forecasts trends in financial markets by identifying extremes in investor psychology. This event will be led by a long-time, very successful portfolio manager who applies Elliott Wave Theory in his analysis of the market. For more information, CLICK HERE.
Happy trading!
