We have added a new page of charts to help us monitor the relative strength of equal-weighted indexes against their capitalization-weighted counterparts. Cap-weighted index values are dominated by the larger-cap stocks in the index. For example, the 50 largest-cap stocks in the S&P 500 represent about 70% of the index value. Conversely, the Rydex S&P Equal Weight ETF (RSP) gives each of the 500 stocks equal weighting when calculating the index value. As a general rule, the equal-weighted indexes will outperform their cap-weighted counterparts because smaller-cap stocks dominate the index, but not always, so we want to monitor their performance so we know where we should put our money.
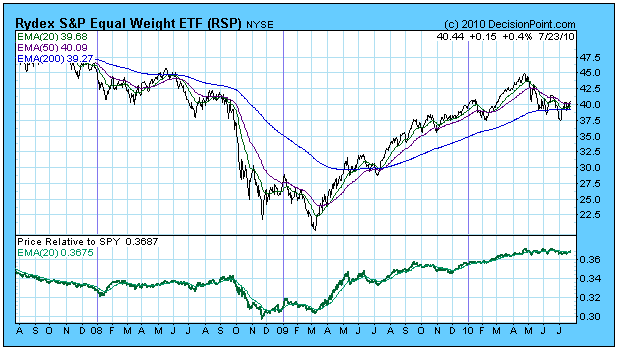
There are 11 equal weighted ETF, 10 of which are sponsored by Rydex. One of those 10 is RSP, mentioned above, and the other 9 are for the SPDR Sectors. Finally, there is the Nasdaq 100 Equal-Weighted Fund ETF (QQEW). The RSP chart below is an example of all the charts on the new page.
Price Relative line is calculated by simply dividing the value of RSP by the SPY. When RSP is stronger, the price relative line rises, and it falls when SPY is stronger. Is this really such a big deal? Well, yes, it is. From the March 2009 low the SPY advanced 87% to the May 2010 top. RSP advanced 125% during the same period, which is 44% better performance.
On the negative side, it appears that the equal-weighted indexes are often weaker during pullbacks and declines, but as a practical matter there are no hard and fast rules, and we need to constantly be aware of the relative performance of these two types of indexes.
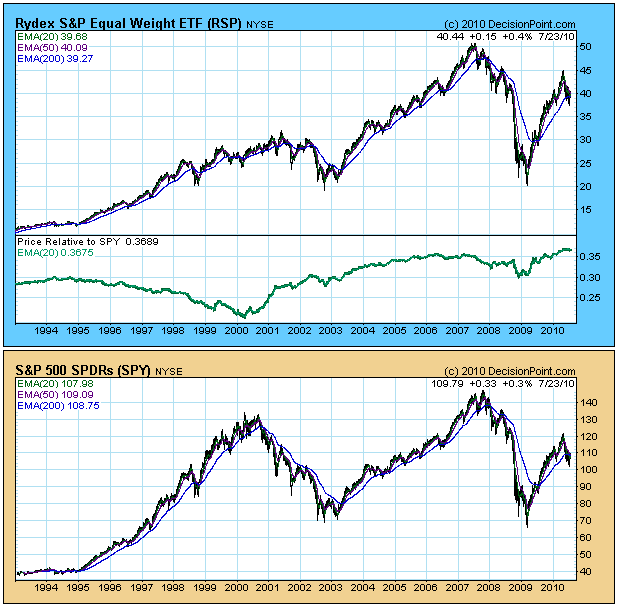
Below are two charts comparing RSP and SPY over the long term. Note the peculiar behavior of RSP during the 1990s. This was when the stock market bubble was inflating, and money was concentrated in large-cap stocks. When the bear market started in 2000, we can see the sudden up turn in relative strength, and RSP didn't hit its bull market top until a year after SPY.
A final comment on performance, from the 2002 bear market low SPY advanced 107% to the 2007 top. RSP advanced 183% during the same period. Why hasn't anyone noticed?
Bottom Line: There are 11 ETFs that feature equal weighted indexes, and we track and generate timing signals on all of them in our Decision Point Alert Daily Report. On market advances these equal weighted indexes normally outperform their cap-weighted counterparts, but shifts in relative strength do happen, so we have set up a page of special charts specifically to monitor relative strength on these indexes.


