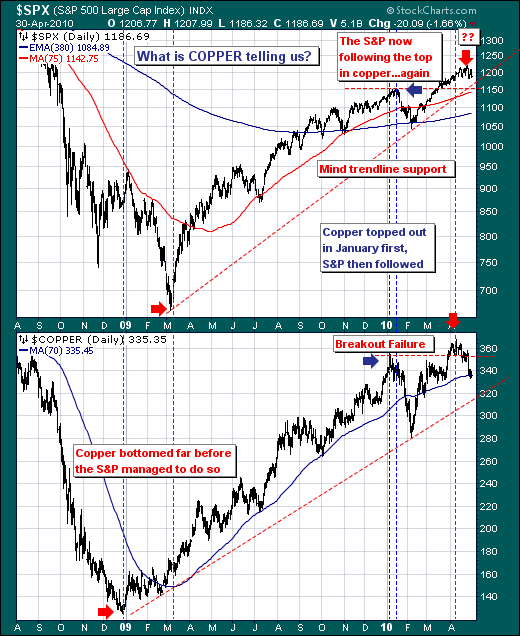
We are rather interested in the manner Copper is trading at present, for Copper has shown itself in recent months to be a leading indicator of the path of the S&P 500. Perhaps this is due to it's economic sensitivity, or perhaps it is due to it's positive correlation with Chinese equities. In any case, the Copper/S&P 500 relationship is important to our trading regime. One cannot help but see that Copper bottomed in late December-2008 before the S&P 500 bottomed in March-2009, which we all know led to a rather material advance until January-2010. At that point, Copper topped out before the S&P 500, and then traded sharply lower - the S&P 500 followed shortly thereafter.
So, it should benefit readers to see that the current Copper decline is rather material, and we're now starting to see the impact of lower Copper prices upon the S&P 500 as it trades lower - with the prospect rather good of still further declines ahead. We're also interested in whether Copper breaks below its 70-day moving average, for it it does - then the S&P should experience weakness through a number of important technical levels such breaking below rising trendline support and very likely below its 75-day moving average at 1150. In the end, major bull market support at 1085, which is roughly -10% from current levels, and well within the tolerances of a "shake-out" correction before the bull market resumes.
Good luck and good trading,
Richard

