Global stock markets have been quite volatile of late and significant gap ups and gap downs are becoming the norm. While trading gaps may seem impossible at times, there is good news technically from the market selloff that resulted from the debt crisis in Europe. In recent articles, I've spoken about long-term negative divergences, overbought conditions and extreme complacency and how that would likely lead to short-term market weakness. That weakness first appeared in the influential financials sector one day before the news of the alleged Goldman Sachs (GS) fraud by the SEC. Shortly thereafter, our two leading major indices - the NASDAQ and Russell 2000 - both printed bearish reversing candles to confirm the uptrend off the early February lows had ended. Even if you weren't inclined to believe that the trend was over, at a minimum, it was important to note the elevated risks.
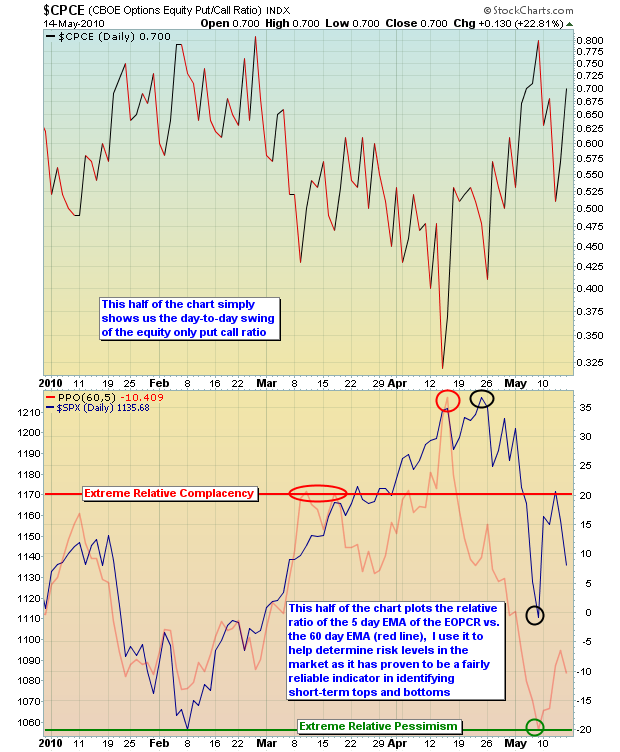
The ensuing selloff has relieved the overbought oscillators and negative divergences. In addition, the extreme relative complacency that certainly contributed to the selling was relieved. After the panicked selling of May 6th and 7th, our equity only put call ratio (EOPCR) printed an extreme PESSIMISM reading that was the highest since November 21, 2008, marking a short-term bottom (see chart below). I've discussed in many articles in the past how the elevated EOPCR can be used on a relative basis to gauge investors' complacency and pessimism. When that ratio reaches extremes, it doesn't necessarily mean the market has topped or bottomed (although in many instances it will coincide with tops and bottoms). Instead, what traders should take from it is that risks are elevated and, at a minimum, hedges should be in place. Acknowledging increased or reduced inherent risks in the stock market is as important as finding quality trades. Risk averse traders/investors could simply move to cash when relative complacency hits high levels. Such a strategy would have avoided the latest carnage. Check out this year-to-date chart of the EOPCR and how the S&P 500 was impacted by swinging sentiment:

Personally, I consider the -20% level (red line) to be "extreme pessimism", at which point I begin looking for other confirming signs of a potential bottom. These confirming signs could be reversing candlesticks, long-term positive divergences, oversold oscillators, an exhaustive gap, etc. On the flip side, the +20% threshold signals that a near-term top could be approaching and hedging strategies (or increased cash levels) should be considered. As you can see from the chart, the relative complacency signaled that long positions carried higher risks starting in mid-March. By mid-April, the relative complacency had grown to over 35%, a record since the CBOE began providing the EOPCR data in 2003. One week later, the major indices began suffering huge losses on very heavy volume. I didn't know when exactly the selling would occur, but I could see it coming. Here was an excerpt from our daily Market Chatter on April 15th, essentially at the market top:
"The bulls continue to overcome everything in their path - at least for now. Historically, April 13th and 14th represent two of the worst trading days of the month. The bulls could care less as the major indices keep marching forward. The extreme complacency that we've been referring to lately apparently wasn't extreme. Yesterday's complacency most certainly was!!! Are you ready for this? How about .33 on the end of day equity only put call reading? Think that's extreme? Well, let us just say it's the lowest daily reading EVER since the CBOE began providing us the equity only data on October 21, 2003. There hasn't been a single day more complacent than yesterday. What added to that complacency was the volume of equity contracts traded. 4 million contracts. While there have been more contracts traded in a day, there has never been the disparity between calls and puts.
Consider this: There were 3 million equity calls traded while just 1 million equity puts. That difference - 2 million more equity calls - far exceeded the previous record of 1.5 million.
We understand what we're seeing, which is the bulls' complete ignorance of every red flag waved in front of them. But we 100% believe that ignoring these signs and simply going along with the crowd without any hedges in place could potentially result in disaster. We're not interested in that strategy and you shouldn't be either. Whether the market continues higher or not in the near-term, it makes no sense whatsoever to be 100% long in this market without a backup plan or hedging strategies in place."
The risks were there and were obvious to me. But everyone has to make his or her own call as to the risks they're willing to take each and every trading day. Given all the volatility of late, knowledge of gap trading strategies is paramount. On Friday morning, we issued our daily Chart of the Day featuring a stock that had recently printed an exhaustive gap. Recognizing that gap, this stock was considered for a short alert and it promptly fell nearly six dollars intraday on Friday. You can check out that chart and video by CLICKING HERE.
Additionally, on Tuesday, May 18th at 4:30pm EST, I will be presenting the second in our monthly Online Trading Series, "Learning to Trade Gaps with Precision". You can learn more about this presentation by CLICKING HERE. I hope to see you there!
Happy trading!
