For the past couple of months, I've been visiting with investments clubs around the country who have been gracious enough to invite me to talk. So far I've talked with clubs in Portland, Pheonix and Dallas. Calgary, Denver, and Houston are coming up with east coast cities to follow in the fall.
I wanted to show you a couple of the slides I used in my Dallas presentation yesterday and give you a pointer to our handout so that you were aware of some of the things in my talk even if you haven't attended one. (At some point, I'll try and post the complete version of the presentation - but that won't be for a while.)
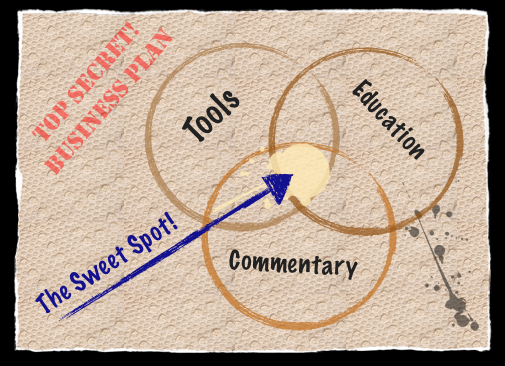
Above is our "top secret" back-of-the-napkin plan for ruling the world. Basically, when John Murphy or Arthur Hill or I write market commentary, we try to make them timely, educational and based on tools that our readers have access to.
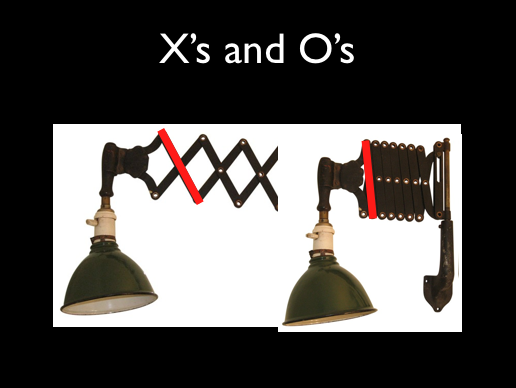
Did you know Point and Figure charts are like "scissor" lamps? It's true! When it is stretched out, it's like the trendlines on a regular bar chart. When it is collapsed, those same trendlines become vertical columns on a P&F chart.
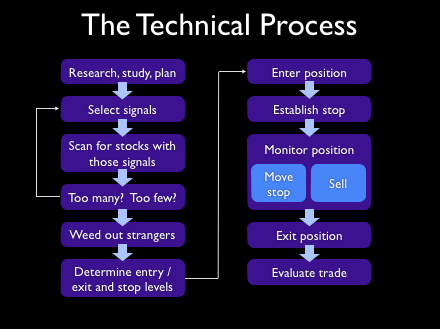
Finally, here's a high-level process flow for doing technical trading:
My presentation then shows how many of our tools can be used to support this process.
- Chip


