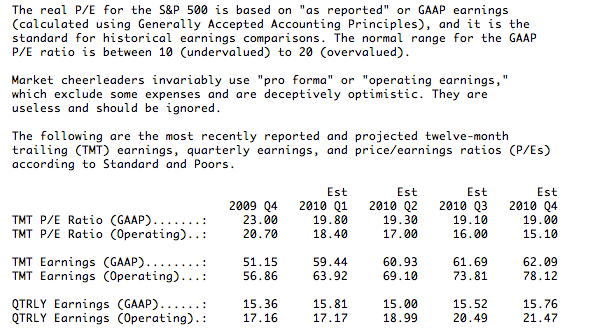
S&P has still not finalized 2009 Q4 earnings, but 99% of companies have reported, and I want to get the most current earnings picture out there, so I have updated our database to TMT earnings as of Q4 2009. This causes the horrible Q4 2008 numbers to drop out of the equation and gives us a more realistic look at valuations.
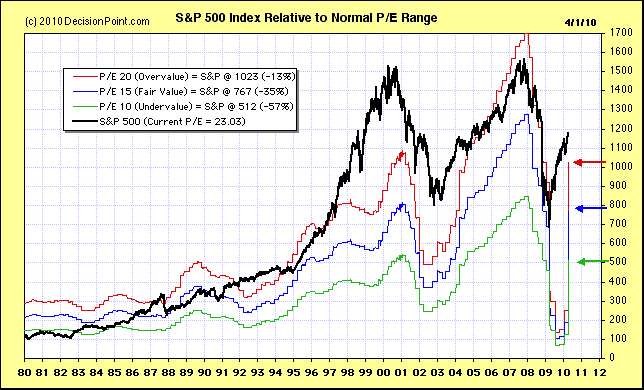
The chart below shows the S&P 500 in relation to its normal P/E range (10 to 20). The colored arrows on the right help to clarify where the cardinal points of the range are now located.

While the picture has improved considerably from a year ago, the S&P 500 is still above the overvalue limit with a P/E of 23. By the end of the year (see below), earnings are expected to improve, but still not enough to get valuations anywhere near fair value (15). If prices continue to advance, the market will remain extremely overvalued.

