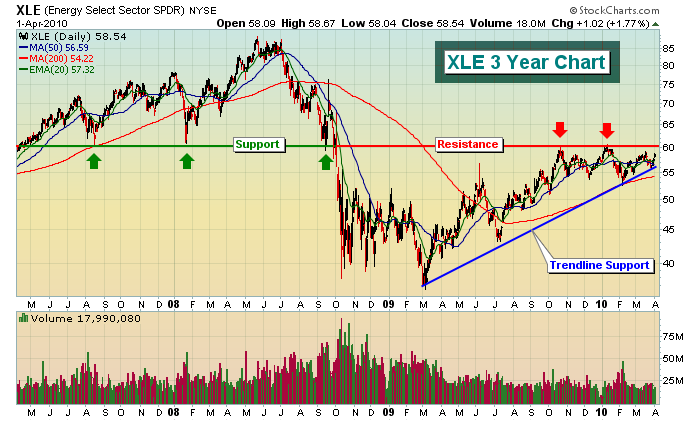
If you're looking for sector leadership in 2010, look no further than the industrials. While other sectors have performed admirably, especially financials and consumer discretionary, none top the 13.13% year-to-date gain that industrials are sporting. Compare that return to the paltry 0.57% gain in technology. Because we've been witnessing a lot of sector rotation, we'd expect to see technology have its day soon, but for now the group can't seem to catch a relative bid. Keep in mind that as recently as one week ago, energy found itself in that exact position. It was down year-to-date, but last week's monster gains changed all that. Energy blew away all sectors last week, gaining 4.39% in the process. Energy bounced off of trendline support, but the sector ETF, XLE, still needs to close above 60 and distance itself from this level. On recent attempts, it's failed. Take a look at this three year chart of the XLE:

While energy looks to key resistance just above current prices and technology looks to regain its form from years past, the industrials are quietly sailing along, having posted gains in 7 of the last 8 weeks (off the February 5th bottom). The one week where industrials "struggled", the XLI lost two pennies. So over the course of the last two months, industrials have barely paused during their steady march higher. How can the group be played on the long side after this huge run up? Well, very carefully of course. Just as money rotates between sectors, it too rotates between stocks within a sector. Therefore, it stands to reason that chasing stocks making 52 week highs with very overbought momentum oscillators within the sector doesn't make much sense. However, stocks in a sector rarely move simultaneously. There are opportunities on a daily basis. One industrial stock that surged on Thursday, breaking above price resistance and its 50 day SMA, carries an RSI of 61 and stochastics of 68, hardly overbought in this environment. I'm featuring this industrial as our Chart of the Day for Monday, April 5. CLICK HERE for details.
Happy trading and HAPPY EASTER!
