Relax Chicago. You're not in the Super Bowl this year. I'm just applying a little Super Bowl-mania to the current state of the stock market. The bears are calling the plays.
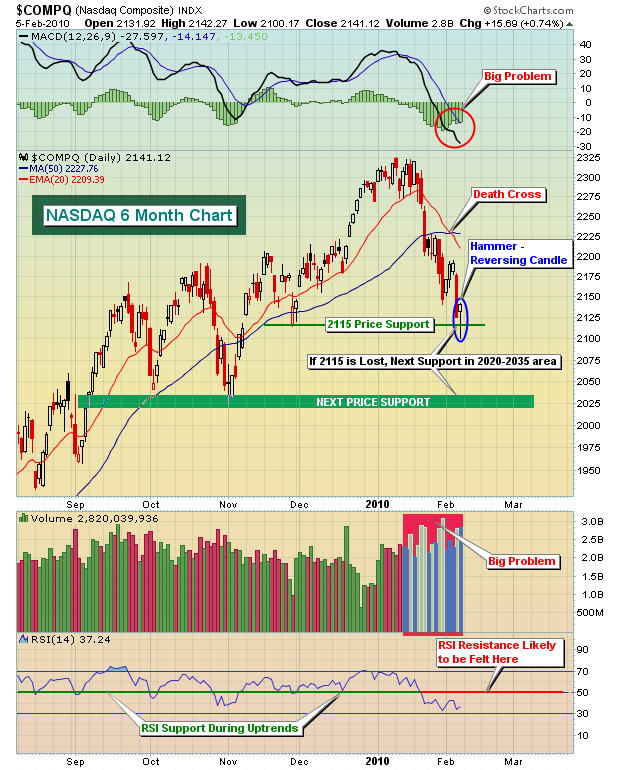
From a sentiment and technical perspective, this market is really making sense right now. The top was identified in early January by analyzing the relative complacency in the market. This was discussed in great detail in my previous article, "It All Comes Down to Defense". At the time that signals suggest a top is imminent, I never know what kind of downtrend or consolidation may follow. In order to make further predictions, it's imperative that we allow the market to communicate its next move. The market spoke loud and clear as very heavy volume accompanied breakdowns of price support, trendlines and moving average support. A "death cross" followed (20 day EMA crossed beneath the 50 day SMA) and our intermediate-term downtrend was underway. As soon as we lost our major moving average support on heavy volume, we adjusted our near-term price support levels to 1036 on the S&P 500 and 2115 on the NASDAQ. Friday, we lost the NASDAQ's support level intraday only to recover strongly into the close, finishing well above 2115 and near the highs of the day. The S&P 500 also reversed strongly on Friday afternoon, although its strong move down earlier merely approached its 1036 support level, falling less than 1% short of it before turning higher. This reversal could bode well for the very near-term, though we are downright bearish the intermediate-term because of technical conditions discussed below. First, take a look at the "kick saves" on the S&P 500 and NASDAQ at or near short-term price support levels.


So short-term a move higher off of Friday's reversing candles is certainly a possibility, perhaps even a very good possibility. But there are serious technical reasons that any up move likely won't last. The first is the most important. We have witnessed a major breakdown of price support, moving average support and trendline support - all on very heavy volume. The combination of price/volume breakdowns can never be overemphasized. Until it is remedied, long-term buy and holders BEWARE. It's actually a good thing for technical traders willing to short stocks and ETFs as bounces can generally be shorted with fairly tight stops in place. It's what we'll continue to recommend to our subscriber base until this bearish price/volume scenario ends.
Also, the MACD is continuing to diverge with every new price low. This is indicative of BUILDING downside momentum. As long as the MACD provides no signs of slowing momentum, we have to assume that the 20 day EMA will likely serve as a significant resistance barrier for the bulls. Eventually, we'll see a long-term positive divergence print on successive price lows and at that time it's likely we'll see a more significant and reliable move higher. Until then, it's best to exercise caution.
Finally, the RSI provides solid clues during both uptrends and downtrends. During uptrends, it's common to see the RSI fall to 50 on market pullbacks. Occasionally, it'll even dip to 40. Rarely do we see RSIs move much below 40 during a sustained bull market advance. During a downtrend, however, the exact opposite holds true. Look for the market to struggle as the RSI hits the 50 level from underneath. On occasion, we might see the RSI print 60, but generally 50 will hold back the bulls.
Everyone has their own ideas of where the market might go from here. I expect we'll see weakness over the next several weeks as a potential flag formation develops. I've included this prediction in our Chart of the Day, which will be featured on Monday. You can CLICK HERE to view this video.
Good luck to the Colts and Saints fans in Sunday's Super Bowl. I'm going with the sentimental favorites. Who Dat Gonna Beat Dem Saints?
Happy trading!
