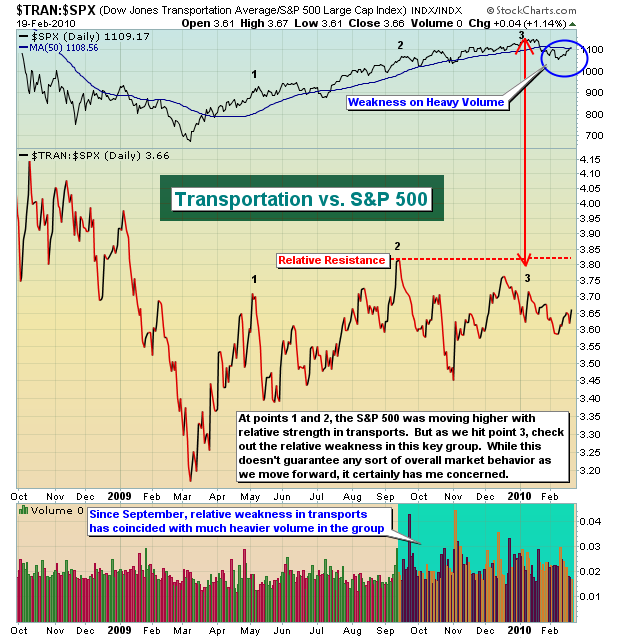
History is a valuable tool in the stock market as we witness cycles repeating themselves all the time. Our major indices and the various sectors and industries rotate back and forth as our economy moves from strength to weakness and back to strength again. Certain sectors perform better during strong economic times while others outperform as our economy stumbles. I like to use this knowledge as the market makes its moves up and down to determine "staying power". For instance, transportation stocks tend to lead the economy out of recession and it makes sense because as economic conditions improve, industries like the railroads are relied upon to ship more goods, etc. So when charts relating to the transportation group begin moving up on a relative basis to the S&P 500, it generally will alert us to the probability that the underlying economy is strengthening and we should look for higher prices in the broader market to continue. When transports underperform on a relative basis, however, it tells us to be a bit more cautious about the overall market. Take a look at the chart below:
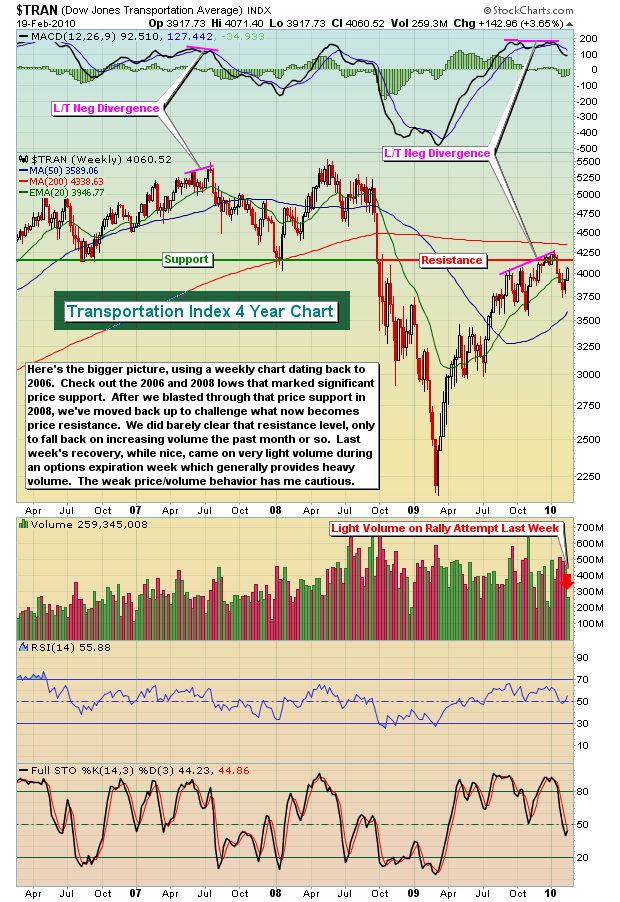
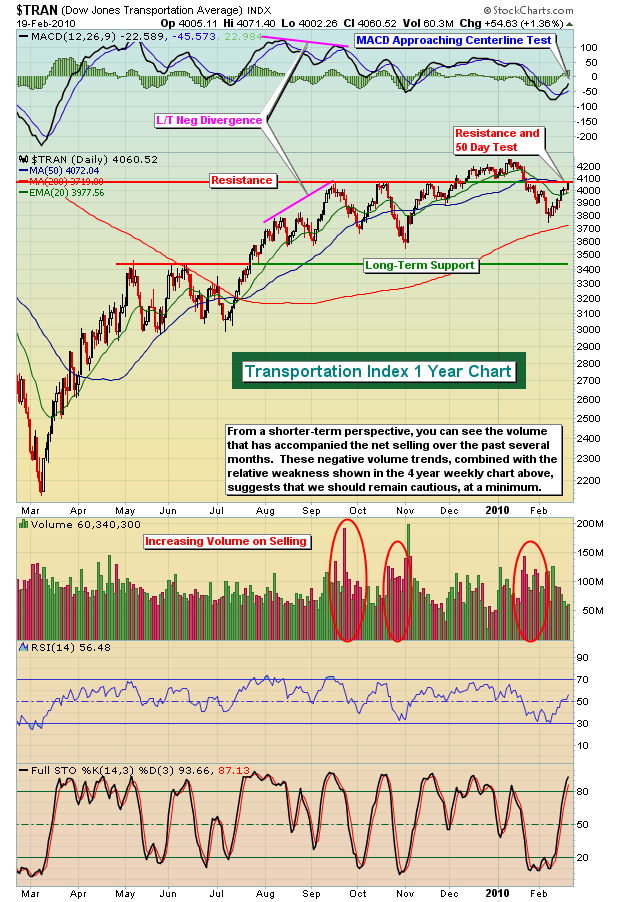
An obvious question to me is - why have transport stocks failed to break out to new relative highs since September 2009? Furthermore, the transportation index made a triple top price breakout above the 4050 area in early December, failed to capitalize with much in the way of further gains, and then broke down badly in late January with very heavy volume. Currently, transports are moving higher on much lesser volume and now are back to challenge that 4050 area and their 50 day SMA. Check out the next two charts:

