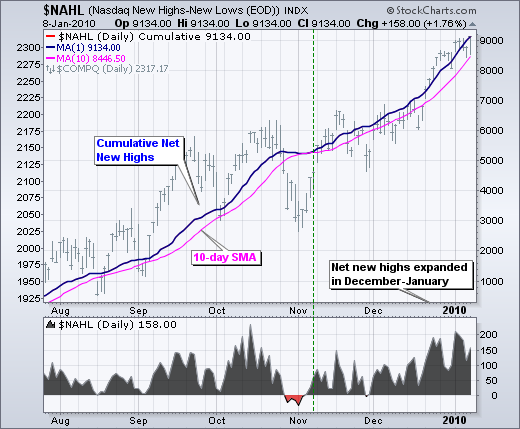
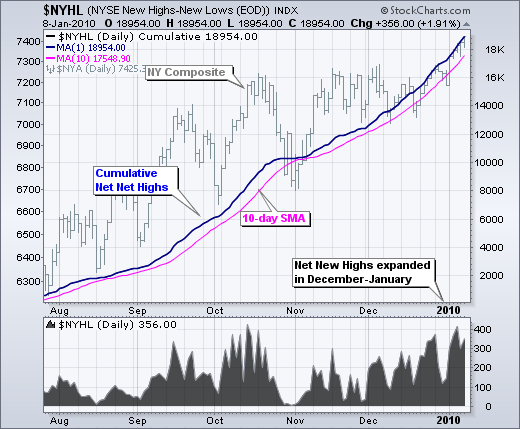
With the advance over the last 3-4 weeks, Net New Highs expanded to their highest levels since October. Net New Highs equals new 52-week highs less new 52-week lows. The bulls have a clear edge when Net New Highs are positive and rising. Conversely, the bears have an edge when Net New Highs are negative and falling. The bottom window in first chart shows Net New Highs for the Nasdaq moving above +200 in early January. This total fell to +158 on Friday, but Net New Highs are clearly in positive territory and this is bullish. The main window shows Cumulative Net New Highs. Like the AD Line, this line rises when Net New Highs are positive and falls when Net New Highs are negative. Except for a brief dip at the end of November, this line has been rising for months. The second chart shows NYSE Net New Highs expanding in December-January as well.
 Click this chart for details
 Click this chart for details
 Click this chart for details
 Click this chart for details

About the author:
Arthur Hill, CMT, is the Chief Technical Strategist at TrendInvestorPro.com. Focusing predominantly on US equities and ETFs, his systematic approach of identifying trend, finding signals within the trend, and setting key price levels has made him an esteemed market technician. Arthur has written articles for numerous financial publications including Barrons and Stocks & Commodities Magazine. In addition to his Chartered Market Technician (CMT) designation, he holds an MBA from the Cass Business School at City University in London.
Learn More