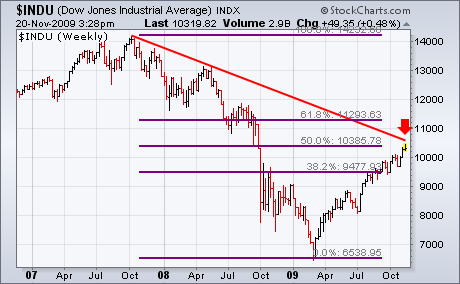
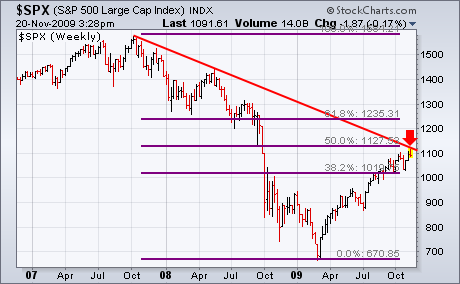
The following three charts show the three major U.S. stock indexes having reached formidable overhead resistance barriers. Charts 1 and 2 show the Dow Industrials and the S&P 500 having retraced 50% of their bear market declines. More importantly, both indexes are testing major down trendlines drawn over 2007/2008 peaks. Given the fact that the market has rallied 60% in the last eight months without a meaningful correction, that's some cause for concern. Chart 3 shows a slightly different picture for the Nasdaq market, but the message is essentially the same. The Nasdaq Composite has reached important overhead resistance along its early 2008 trough around 2200. That puts all three stocks up against meaningful resistance barriers. Combined with the fact that numerous short-term divergences are starting to appear among market groups, and the recent rotation toward large-cap stocks in the consumer staple and healthcare categories, it looks like investors are starting to lock in or protect some yearend profits. That could lead to choppier market conditions.


