This is the ninth part of a series of articles about Technical Analysis from a new course we're developing. If you are new to charting, these articles will give you the "big picture" behind the charts on our site. if you are an "old hand", these articles will help ensure you haven't "strayed too far" from the basics. Enjoy!
(Click here to see the beginning of this series.)
Price Channels
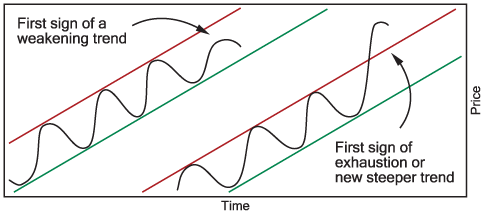
Trending prices often form a channel where prices can be bounded above and below by parallel trendlines. When trend channels form, it is helpful to draw the top and bottom trendlines and monitor how well prices stay within the channel.
If prices in an uptrend fail to reach the upper channel line, the uptrend may be weakening and getting ready to reverse. Also, if prices suddenly break above the upper channel line, the uptrend may be either beginning to exhaust itself and reverse direction or be starting a new, steeper trend. Similar behavior also happens in downtrend price channels.
Trend Changes
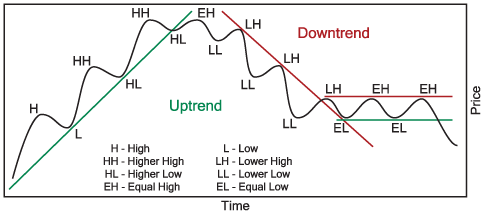
Trending prices can only go three directions; continue in the direction of the trend, change to a trading range or reverse the direction of the trend. Trend changes are most easily recognized by watching the price peaks and troughs. An uptrend makes ever higher price peaks and troughs. A downtrend makes ever lower price peaks and troughs. And a trading range price peaks and troughs are roughly equal over time.
A change in uptrend begins when a new price peak is similar or lower than the previous price peak. The change is confirmed when the next price trough is similar or lower than the last price trough.
Changes in downtrends and price ranges occur the same way, new price peaks or troughs break the pattern of prior peaks and troughs with the next peak or trough confirming the change.

Price and Volume Data Adjustments
When a company declares a normal stock split, additional shares are created in a ratio to the current available shares. For a 2:1 (two-for-one) stock split, every pre-split share will be replaced with two shares. Share prices are subsequently reduced by the split ratio (1/2 in this case) to maintain the total value (price multiplied by the total number of company shares) of the company. In a reverse stock split, the total number of shares is reduced by some ratio, resulting in the stock price being raised by that ratio.
Price and volume data adjustments are necessary for technical indicators to be valid during the period of the stock split. To accomplish these adjustments, pre-split prices are reduced by the split ratio and pre-split volume is increased by the split ratio. The opposite adjustments are made for reverse stock splits.
Data adjustments are made in the same way for dividends and mutual fund distributions.
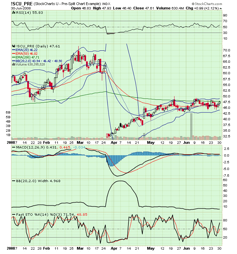
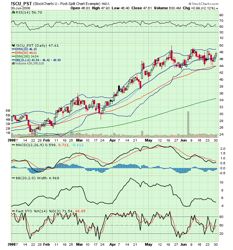
The following charts illustrate prices before and after a data adjustment for a stock split. Notice how several strong "sell" signals on the first chart have disappeared on the adjusted chart.
Next time, we'll look at how volume can confirm trend change signals.


