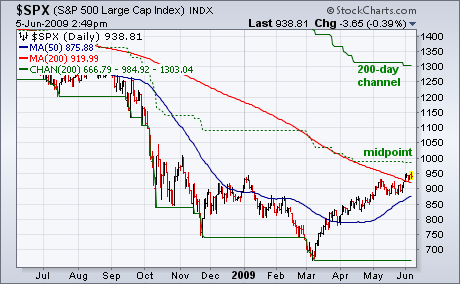
Virtually all major market indexes (including the Dow) have now exceeded their 200-day moving averages. That's a positive sign for the stock market, and adds more weight to the view that a major bottom has been seen. As I wrote a couple of weeks ago, however, the "direction" of the moving average line itself is also important. Legitimate bull markets usually require that the 200-day average also turn higher. For that to happen, stock indexes have to first clear the 200-day line (which they've done). Then, stock indexes have to reach the price level formed 200 days ago. In other words, the latest closing price has to exceed a closing price 200-day days ago. The solid line on top of the chart below shows the 200-day "price channel" currently at 1303. It's doubtful that prices will reach that level in the near future. The S&P has yet to even clear the middle (dotted line) which currently sits at 985. [The dotted line sits midway between the upper and lower channels and often acts as resistance in a downtrend]. As good as the spring rally has been (with most indexes having also cleared their January highs), I believe that the market is still in need of some corrective action (or consolidation) before moving substantially higher. V bottoms are extremely rare. W bottoms are a lot more common. So are head and shoulder bottoms. It seems unlikely that the market will continue to rally in a straight line. More basing activity is most likely needed. And that's going to require more time.

