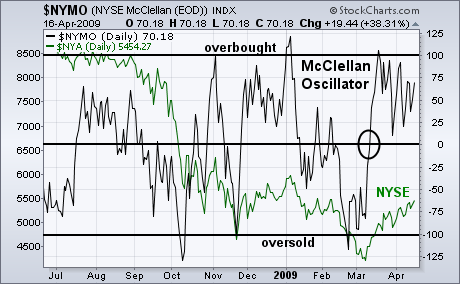
The McClellan Oscillator is a short- to intermediate-term momentum breadth indicator. It's calculated each day by taking the difference between the 39-day and 19-day exponential moving averages of the number of net advances on the NYSE (see Chart School for a more in-depth explanation). The chart below shows the NYMO (black line) compared to the NYSE Composite Index (green line). The McClellan Oscillator fluctuates between an oversold level below -100 and overbought territory above 100. Short-term buy and sell signals are given when it crosses above or below its zero (flat) line. The chart shows, for example, the NYMO bouncing from oversold territory in late February before crossing over its zero line in early March (circle). Although it has backed off from overbought territory at 100, it remains above its zero line. It would have to fall below that line to signal an end to the rally. The McClellan Oscillator is only useful over the short to intermediate term. In my view, its greater value lies in its longer-range version which is called the Summation Index.

