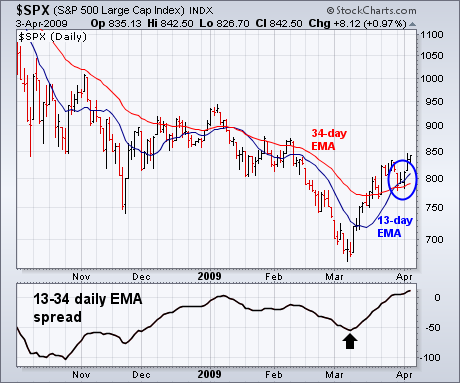
I've received a number of requests to review the current position of the 13-34 exponential moving averages (EMAs). As you probably know, I place a lot of importance on that combination because of its strong track record over the years. I apply the 13-34 EMA combination to daily, weekly, and monthly charts. Let's start with the "daily" lines which measure the market's "short-term" trend. Chart 1 shows the 13 and 34 day moving average combination. For a short-term buy signal to occur, the 13-day (blue line) has to cross over the 34-day (red line). That short-term buy signal took place earlier in the week. But there's more. The black line below chart 1 plots the "spread" between the two EMA lines. [You can create that line by inserting 13,34,1 into the MACD indicator]. You can see a positive divergence taking place during March when the black line held above its October low (black arrow). [We've shown similar positive divergences in several other technical indicators]. More importantly, the black line has exceeded its January high and risen above the zero line for the first time since last May. [A crossing above the zero line by the black line coincides with a positive EMA crossing]. That's a sign that the current rebound has legs.

