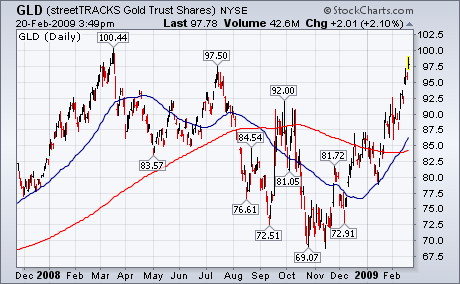
GOLD TOUCHES $1000 FOR FIRST TIME IN A YEAR... A number of financial markets are testing important chart points. Let's start with gold. Bullion touched $1,000 today for the first time since last March. Chart 1 shows the streetTracks Gold Trust (GLD) very close to touching its March 2008 high at 100. On a short-term basis, however, the price of gold looks overbought. Some profit-taking from this level wouldn't be surprising. If that's true, some counter-trend moves may be seen in some other markets. The dollar may have also started one.

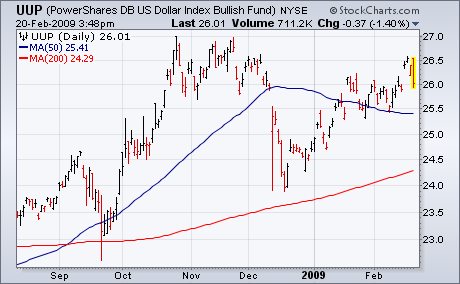
DOLLARS DIPS AS EURO BOUNCES ... The U.S. Dollar has been rising along with gold since December. Chart 2, however, shows the
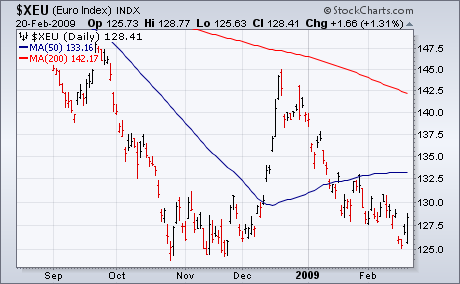
Power Shares DB US Dollar Index Fund (UUP) dropping today from chart resistance near its November high. Chart 3 shows the
Euro bouncing off chart support along its November low. That suggests that some "short-term" market dynamics might be changing. A weaker dollar might contribute to some profit-taking in gold and buying in some oversold commodities. A bouncing Euro might suggest that the recent selloff in stocks is overdone as well. I've shown before that stocks have been trading in tandem with the Euro since midyear and opposite the dollar.

About the author:
John Murphy is the Chief Technical Analyst at StockCharts.com, a renowned author in the investment field and a former technical analyst for CNBC, and is considered the father of inter-market technical analysis. With over 40 years of market experience, he is the author of numerous popular works including “Technical Analysis of the Financial Markets” and “Trading with Intermarket Analysis”. Before joining StockCharts, John was the technical analyst for CNBC-TV for seven years on the popular show Tech Talk, and has authored three best-selling books on the subject: Technical Analysis of the Financial Markets, Trading with Intermarket Analysis and The Visual Investor.
Learn More

