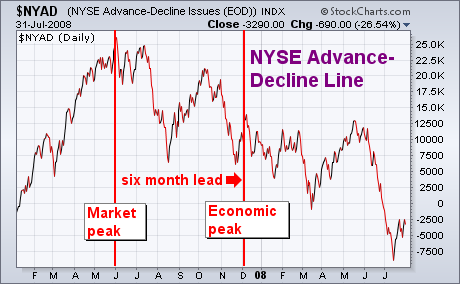
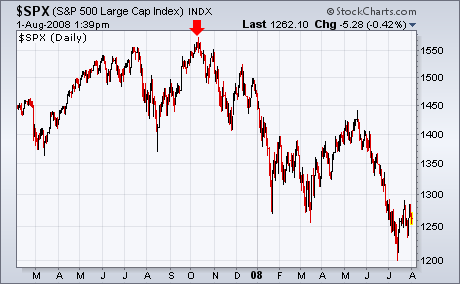
In a recent Market Message, I discussed how the stock market is a leading indicator of the economy and why it isn't a good idea to use economic forecasting to trade the stock market. Historically, the market turns down at least six months before the economy. Chart 1 shows the NYSE Advance-Decline Line peaking last June. That suggested a possible recession by December of last year. Chart 2 shows the S&P 500 peaking last October. That puts the odds for a recession somewhere around April of this year. This week's economic reports showed that second quarter growth was below economic forecasts. It probably would have been even worse without a temporary boost from rebate checks. More importantly, GDP growth for the fourth quarter of last year was actually negative. It was reported this morning that the unemployment rate for July rose from 5.5% to 5.7% to the highest level in more than four years. A number of economists were quoted over the last two days saying that the economy was now in recession. Thanks for that late newsflash nearly a year after the stock market started dropping. These are the same folks who accused investors of panicing at the end of last year by using the "fear versus fundamentals" slogan that was flashed on TV screens. With the stock market now in an offical bear market, what are investors supposed to do with the newfound pessimism in the economic community? How many times do we have to repeat this cycle before people realize that the only way to trade the stock market is to study the market itself -- not the economy. The study of the market is what the charting approach is all about. And what Stockcharts.com is all about.


