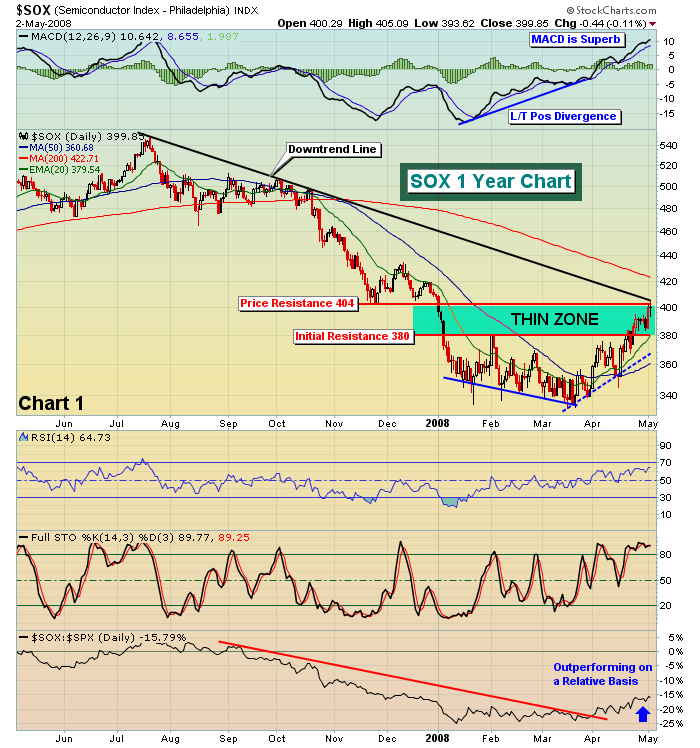
It's been a long time since we've spoken about semiconductors or financials in a positive light. But times have changed and so have the charts for these two influential groups. Semiconductors are showing clear relative outperformance, but have now reached a critical resistance area. Check out Chart 1 below to see how the recent rally in semis have left them vulnerable as key resistance is tested. A break above would be quite bullish, but we'll need to see it first.

Once the SOX broke through 380, there was very little resistance until the 404 level. We tested that on Friday and are now watching to see if this group can gain additional momentum by taking out key price resistance and the long-term downtrend line.
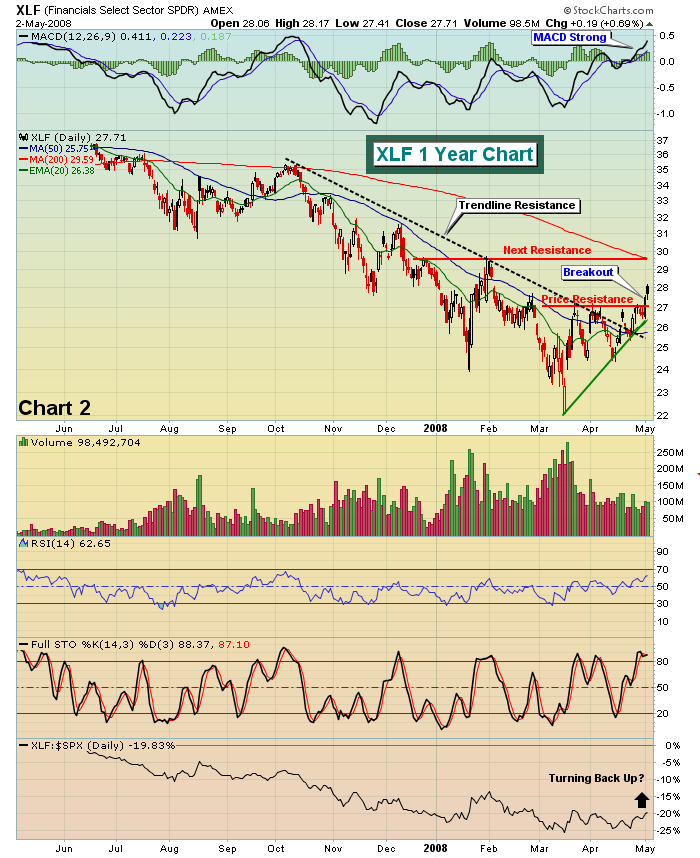
Financials are not quite as strong as semiconductors on a relative basis, but we are seeing signs of technical strength from that group. On Thursday, the XLF cleared 27.00 after battling resistance there on several occasions. Chart 2 shows the technical significance of this move.

The XLF first broke downtrend resistance and finally took out price resistance at 27.00. Based on the chart, it appears that the XLF won't run into serious resistance until the 29.60 area. 26.90-27.00 should act as solid support on pullbacks during consolidation.
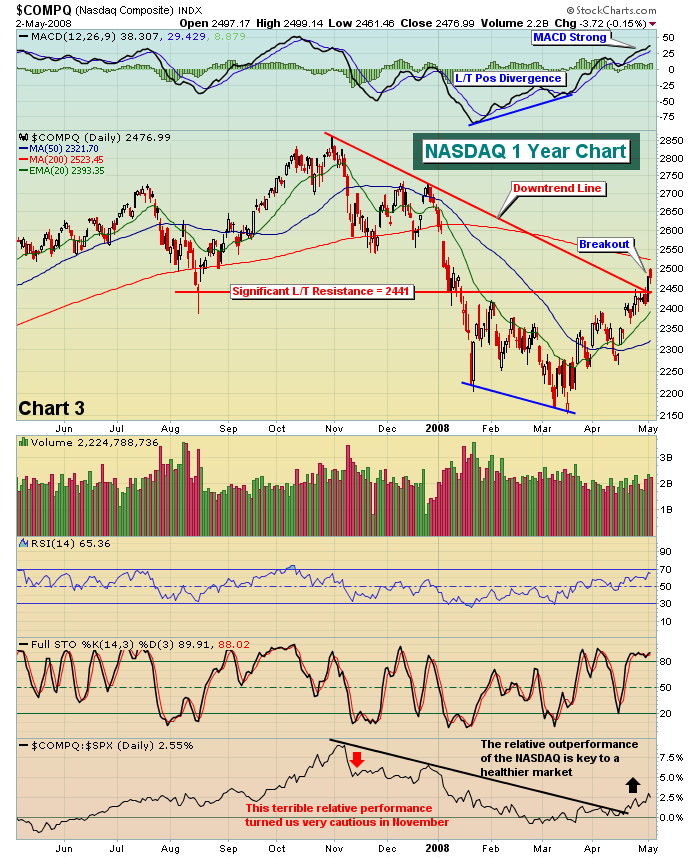
Financials and technology shares were leaders as the major indices broke above key resistance areas. Below in Chart 3 is a snapshot of the NASDAQ as it broke not only critical price resistance, but also the multi-month downtrend line that had been difficult for the bulls to conquer during prior attempts.

We remain optimistic and bullish until technicals suggest otherwise. Ignore the CNBC noise and follow the money.
Happy trading!
