In the February 3rd edition of ChartWatchers, I made a bold prediction that the market had bottomed with the January lows. I did so because of the extreme pessimism in the options world. If you go back to 1995, the year that the Chicago Board Options Exchange began providing investors with historical put call readings, and average the daily put call readings, you'll find that 0.75 is the "norm". That's been the average end of day reading over the past 12-13 years. A .75 reading on the put call ratio means that for every 3 puts bought, 4 calls are bought. 3 divided by 4 = .75. When the ratio moves above 1.0, it indicates that more puts are being bought than calls. Now let's take it one step further - let's looks at the "equity-only" put call ratio. This strips out the index options used as part of more complex trading strategies employed by portfolio and hedge fund managers, and other investment professionals. The "equity only" put call ratio gives us much more of a sense of the individual traders' psyche.
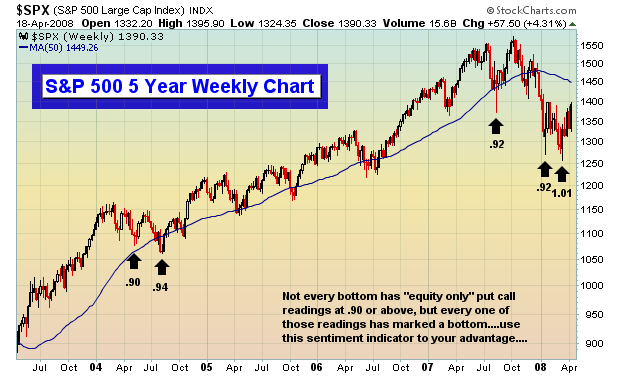
Since October 2003 - the CBOE began breaking out equity options vs. index options at that time - the "equity only" put call ratio has hit or topped 1.0 on just 16 occasions. 3 of those occasions came on consecutive days from August 14-16, 2007. That marked a very significant bottom in the market. Then a month or so ago, it happened again. The retail investor couldn't take the pain any longer and jumped in on the "sure-fire" bet that the market would fall into oblivion. The "equity only" put call ratio spiked to 1.35 on March 17, 2008. That was the highest reading ever recorded at the CBOE since it began providing the "equity only" data. The 5 day moving average of the "equity only" put call ratio hit 1.01 that same day, also the first time we've seen that.
Would you like to take a guess as to which day the Dow Jones, S&P 500, NASDAQ, NDX, Russell 2000, and SOX all mysteriously hit their lows to launch the recent bullishness?
March 17th.
The chart below reflects the 5 times since 2003 that the 5 day moving average of the "equity only" put call ratio has exceeded .90. In every single case, that bearishness by the retail investor marked a very significant bottom.

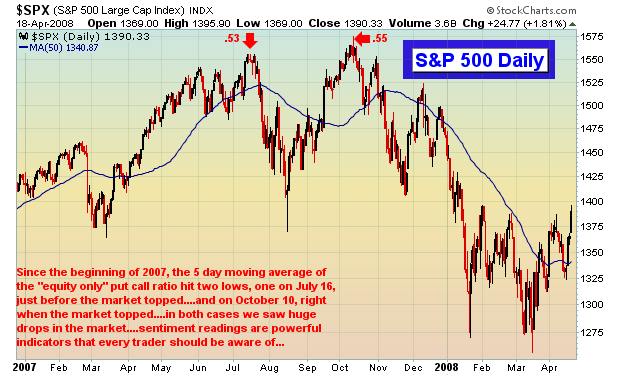
And in the event you're wondering what happens when the "equity only" put call ratio declines to an extremely bullish level, check out the market's reaction in 2007 when the 5 day moving average of the "equity only" put call ratio hit its two lowest levels:

Clearly, the market has a renewed sense of bullishness as we've entered spring. The season has changed and so has the game. There's a reason the market is so resilient. The economy hasn't magically improved. We've simply run out of sellers.
Happy trading!
