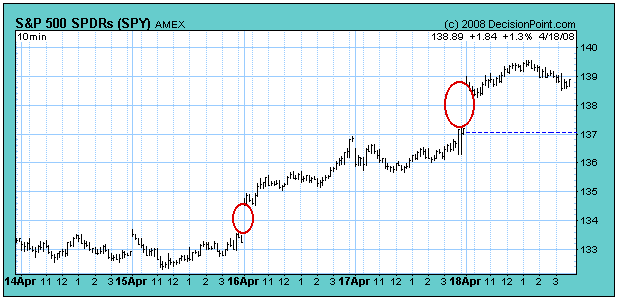
On Wednesday and Friday of this week the market opened up with large gaps from the previous closing price, and I think this activity is suspicious, possibly contrived. It is, after all, options expiration week, and weird market action can be expected. This week it is likely that the big money wanted to stick it to the bears and put holders, as usual, and they did so quite skillfully.
These large up gaps can be contrived by heavy buying of S&P futures just before the market opens. There is usually a bullish cover story available to use as justification for the initial buying spree. When the market opens, many bears are forced to cover in order to limit losses, so the price advance is supported by real buying. Next, the reluctant bulls are sucked into the move as they begin chasing the market.

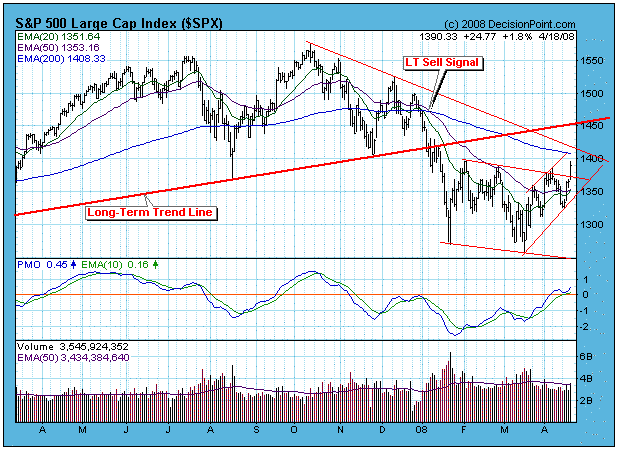
While I tend to believe that price action speaks for itself, we are in a bear market, and I expect that volume should confirm such enthusiastic price moves. In these two cases, I don't think it does. As you can see on the chart below, volume is only average, not explosive like price movement. So what we have is a breakout on modest volume, and strong overhead resistance dead ahead in the form of the 200-EMA, the declining tops line, and the long-term rising trend line.

Bottom Line: We are in a bear market, and the 6-month period of negative seasonality begins at the end of this month, so we should expect bearish outcomes. In this case, the rally should fail before it penetrates the 1450 level. Having said that, you will note that all but one of the 27 market and sector indexes are on intermediate-term buy signals. That is because our primary model is designed to enter rallies relatively early. Because the long-term model is still on a sell, we should expect that the intermediate-term signals will fail in a short time. When the PMOs (Price Momentum Oscillators) begin to reverse downward, that would be a good time to consider closing long positions.
