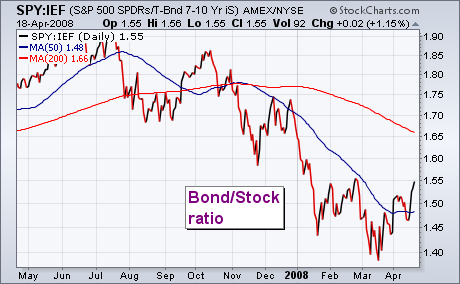
This week's market action has been characterized by stock buying and bond selling. The change in the relationship between those two markets is shown in the chart below which plots a ratio of the 7-10 Year Treasury Bond Fund (IEF) by the S&P 500 SPDRS (SPY). The falling ratio since October shows that investors have favored bond prices over the last six months. Since mid-March, however, the ratio has turned up. That means that investors are rotating out of bonds and back to stocks. The rise in the ratio isn't enough to signal a major trend change between the two asset classes. But it does show that investors are feeling a bit more optimistic. Rising bond yields gave a boost to the dollar today and caused heavy profit-taking in gold.

