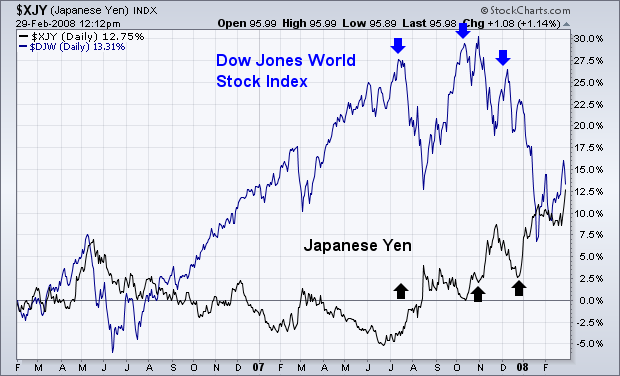
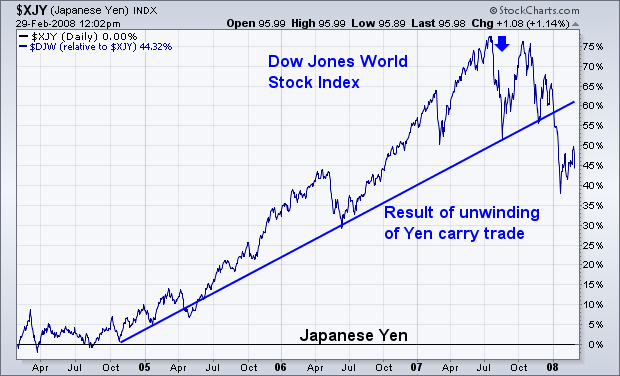
I first started writing about the danger posed to global stocks last summer when the yen first started rising. I also wrote that was because a rising yen was part of the unwinding of the so-called "yen carry trade". Over the last few years, global traders had been borrowing yen at almost no interest charge (shorting the yen) and using those funds to buy higher-yielding assets elsewhere including currencies and stocks. For awhile, it almost seemed like the global rally in stocks was predicated on the yen staying down and providing a continuing supply of cheap global liquidity. That all started to change last summer. Chart 1 shows a generally inverse relationship over the last two years between the Dow Jones World Stock Index (blue line) and the yen (black line). Note that every blip in the yen since the start of 2006 coincided with a market pullback. Last summer, however, the yen turned up in a more serious way. The upturn in the yen during July coincided exactly with the start of the topping process in global stock markets. Each subsequent yen upturn (November and December) coincided with another stock peak. That certainly suggests that yen strength is contributing to global stock weakness. That's because traders are now being forced to buy back yen shorts and sell assets elsewhere. Chart 2 shows the impact of the rising yen even more dramatically. That chart compares global stocks (blue line) to the yen (plotted as the black zero line). The blue line is in effect a global stock/yen ratio. It shows that a rising yen has been a bad thing for stocks. And there's no sign of that negative trend ending. At the risk of a bad pun, Chart 2 shows that a stronger yen has stopped "carrying" the bull market in stocks.


