All mechanical models have weaknesses, and our Thrust/Trend Model is no exception – it is vulnerable to whipsaw. Whipsaw occurs when the market moves just enough in one direction to trip the signal triggers in the model, then it reverses direction and moves just far enough to trigger a reverse signal. This results in a loss on the previous signal. This has happened a number of times in the last several months.
Our model is designed to capture intermediate-term trends and to ride out the zigzag movements and minor corrections that occur as the market trends up or down; however, when the market is in the process of forming a top or bottom, the associated chop can be sufficient to whipsaw the model a lot. Also, bear market rallies can be quite violent and often exceed normal expectations, so whipsaw is quite common then.
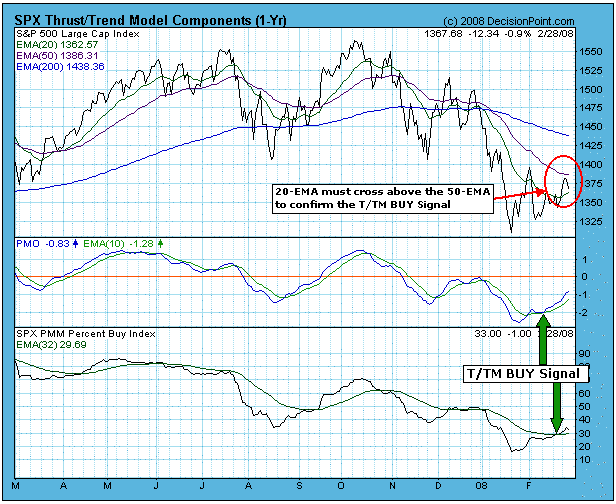
Looking at the chart below, you can clearly see the numerous 20/50-EMA crossovers that have occurred in the last year, something that would not happen if the market were in a solid trend. More important, let's look at what is probably the most recent whipsaw.
The Thrust/Trend Model (T/TM) generates a buy signal any time the PMO (Price Momentum Oscillator) and the PBI (Percent Buy Index) have both crossed up through their moving averages. This is a relatively short-term event, and the signal should be considered short-term until the 20-EMA of price crosses up through the 50-EMA. This action confirms or "locks in" the buy signal, and the PMO and PBI become irrelevant. Next a sell or neutral signal would be generated when the 20-EMA crosses back down through the 50-EMA.
Getting back to the current buy signal, notice that I have marked with green arrows the moving average crossovers that generated it. At this point, it is highly likely that this signal will prove to be a fakeout, because the 20-EMA is a long way from managing an upside crossover of the 50-EMA. The next most likely event will probably be the PMO or PBI crossing down through a moving average, which will generate a sell signal.

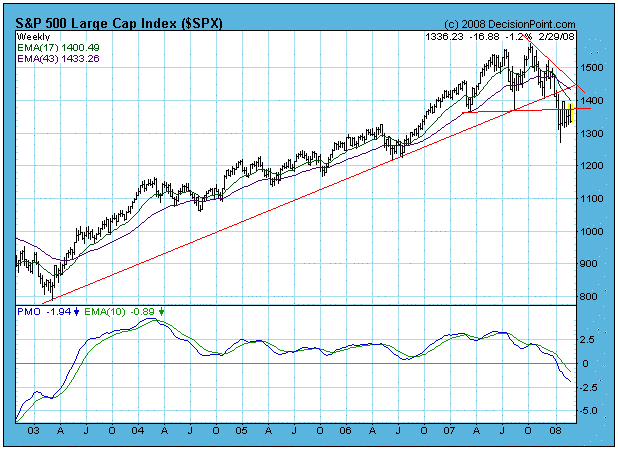
It is important to remember that T/TM buy signals, particularly in a bear market, are short-term events, and discretionary decisions are necessary to avoid the losses whipsaw can cause. How do we know we are in a bear market? Again, when the 50-EMA crosses down through the 200-EMA on the daily chart, we assume a bear market is in force. On the next chart, a weekly-based chart of the S&P 500 Index, we use the 17/43-EMA crossover as a bear market signal. Clearly, the total picture on this chart is pretty grim.

Bottom Line: Oversold market conditions and a fair amount of manipulation from the sidelines has not been sufficient to move the market out of the consolidation range of the last several weeks. This should not be a surprise because we are in a bear market, and in a bear market we should expect negative outcomes.
