The two most frequently asked questions these days are as follows: (1) Are we in a bear market? (2) Where's the bottom?
Let's take them one at a time. A bear market is generally defined as a decline of 20% or more. At the close on Friday, the declines across the major indices from their recent highs are:
Dow Jones: -2181 pts, or -15.27%
S&P 500: -251 pts, or -15.93%
NASDAQ: -521 pts, or -18.21%
NASDAQ 100: -395 pts, or -17.64%
Russell 2000: -183 pts, or -21.38%
The Russell 2000 is already in a bear market and the other indices are closing in on it. We believe it's going to be close as to whether all the indices actually hit that 20% decline. Pessimism has been ramping up in the last 2 or 3 trading days and extreme pessimism marks significant intermediate-term or long-term bottoms nearly every time.
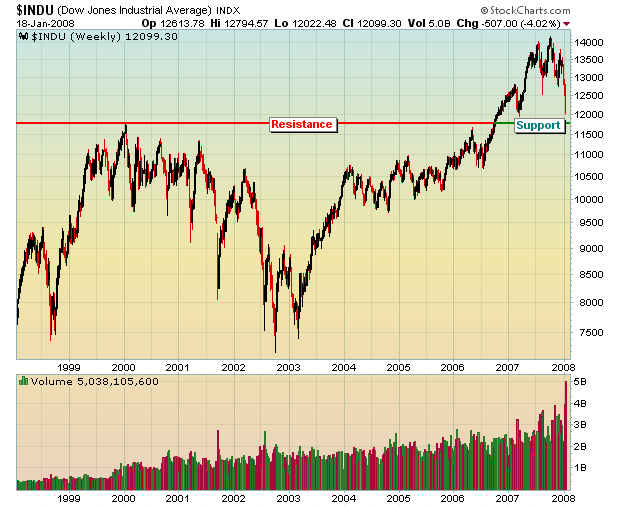
Now let's tackle that second question - how low might we go? First, look at the 10 year weekly chart on the Dow. There was a long-term double top at 11,700 that finally gave way in the second half of 2006, as can be seen below:

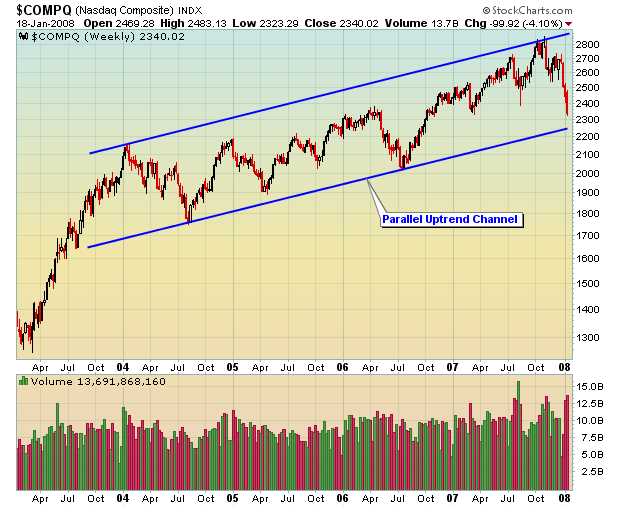
On the NASDAQ, we're watching a long-term parallel uptrend channel that's been in place for over 4 years. If that channel is broken, then more downside is entirely possible. Below is a look at that long-term channel:

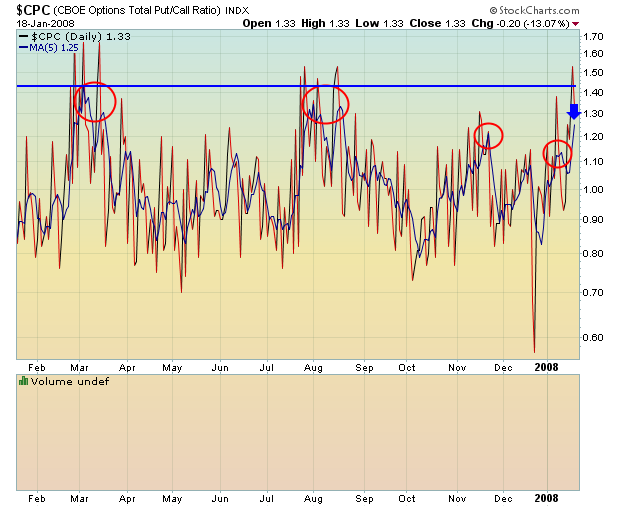
Perhaps the most important factor in the market right now is the increase in pessimism as reflected by the spike in the VIX at the end of last week and the increase in the put call ratio. In both March and August of last year, bottoms occurred as the 5 day moving average of the put call ratio moved above 1.30. That signaled extreme bearishness in the options world and the market bottomed as the put call ratio is a contrarian indicator. In November 2007 and again in early January, the market was dropping, but fear was not hitting panic levels. That has begun to change and will be a very important indicator to watch as the next week unfolds. In the chart below, you can clearly see the spiking 5 day moving average as significant bottoms were reached in March and August of 2007 (red circles):

From the blue arrow at the right hand side of the chart, you can see that fear is ramping up considerably with last week's selling. Continuation of that trend will increase the odds of a significant bottoming process.
Happy Trading!
