Lots of people are doing the Chicken Little thing these days. Is the concern/panic justified? Are we really entering a new Bear market? Which charts are going to calmly and objectively tell us what is really going on?
Whenever I want to study "the big picture" and see if anything really significant has changed, I usually turn to the "Bullish Percent" charts that we maintain here at StockCharts.com. For those of you that haven't heard of them before, a "Bullish Percent" chart plots the percentage of stocks in a predefined group that currently have a "P&F Buy Signal" on their Point and Figure chart. You can read more about Bullish Percent charts here.
Usually, Bullish Percent Indices oscillate lazily somewhere between 30 and 70. Because they are the result of studying thousands of charts, the BPI's for the Nasdaq Composite and the NYSE usually move pretty slowly and it takes them a little bit of time (at least a week) to reflect a significant change in the market. While they may be too slow for day-traders, that slowness makes them very reliable for the rest of us.
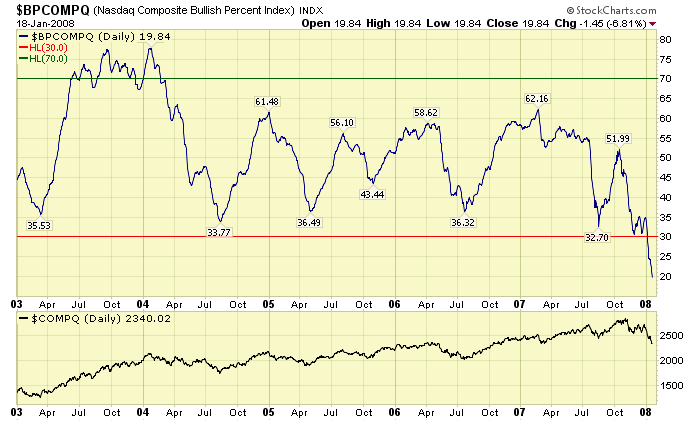
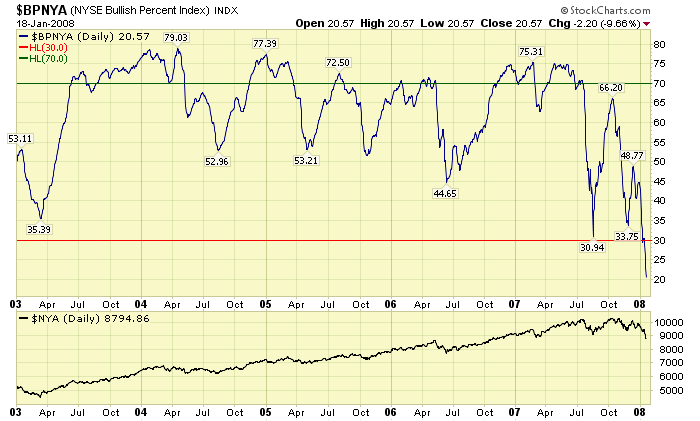
So, with all this talk of a Bear market, what do the BPI's say? Here are the charts:


Well... I think the word "Yikes!" might actually apply here. Both the Nasdaq and NYSE BPIs are now lower than they have been since the start of the Bull Market in 2003. That should give any ChartWatcher pause. Remember, readings below 30 indicate a change in the market and right now these charts have reading at or below 20.
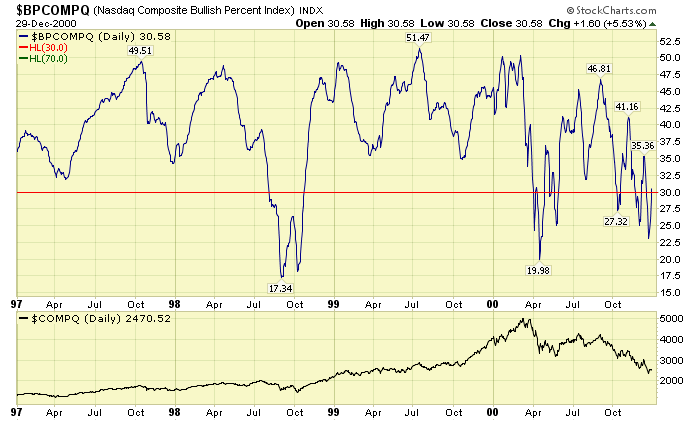
Usually, the BPIs bounce back from super-low readings quickly. If that happens in the coming weeks, don't be fooled. Continue to watch them closely because a second plunge below 30 after a recovery would be confirmation of a Bear Market. Check out this chart of the lead up to the 2001 Bear Market:

After the first BPI-plunge in mid-1998, things recovered and the Nasdaq soared to record heights. But the second BPI-plunge in 2000 confirmed the end of good times for everyone.
Be careful out there.
