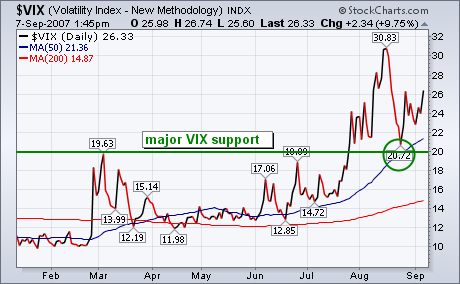
Earlier in the week I heard a TV commentator (masquerading as an analyst) give his interpretation of the CBOE Volatility (VIX) Index. His conclusion of course was bullish. He correctly pointed out that peaks in the VIX usually coincide with market bottoms. He then bullishly concluded that since the VIX peaked in mid-August, the market had bottomed. The problem with that bullish interpretation is that the major trend of the VIX is still up. Recently, I wrote that the VIX would probably find major support near the 20 level before turning back up again. I got the 20 support number from two sources. One was the 50-day moving average. The other was the March peak. Pullbacks in an uptrend should always find support near a previous peak. If the VIX is turning back up (as it seems to be doing), that would signal the end of the market rally and not the start of a new uptrend. Here again, when you hear TV people doing their version of technical analysis, turn off the sound and look at your chart.

