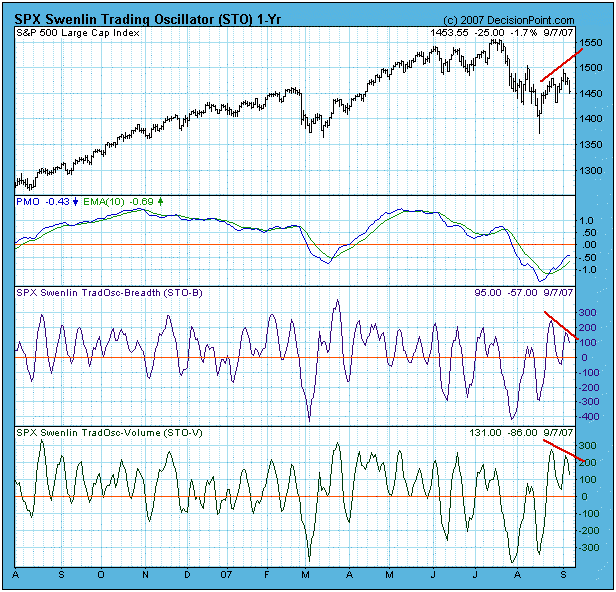
It is well known that October is the cruelest month on average, but sometimes September beats October to the punch. This may be one of those times. Looking at the chart below we can see that the market has bounced out of the August lows and has formed two short-term tops, the last being higher than the first. Corresponding with those rising tops are two sets of declining tops on the two short-term technical indicators. This is known as a negative divergence, and it is a short-term bearish sign that probably is announcing an impending retest of the August lows.
The fact that we are looking for this retest in September, a sometimes cruel month, could mean that the retest will be more scary than most people are expecting. I would not rule out a failed retest that sees prices fall past the August lows and plunges us into a bear market. This is not a prediction, just a possible scenario that ought to be considered.

What I really want to see is a successful retest and a resumption of the bull market, but, as we all know, "you don't always get what you want." For one thing the bearish outcome discussed above could be the ultimate outcome, but it could break the other way as well. By that I mean that we may not get the retest that would put our minds at ease and prepare us mentally for the next big rally. Instead the market could already be in the beginning of the next big rally.
Bottom Line: The odds favor a retest, and that decline could turn nasty in a hurry. Unless we see more buy signals on the major market indexes, I will be staying out of the market until the retest (or whatever) is complete.
Regardless of my personal opinion, we rely on the mechanical trend models to determine our market posture. Below is a recent snapshot of our primary trend-following timing model status for the major indexes and sectors we track. Note that we have added the nine Rydex Equal Weight ETF versions of the S&P Spider Sectors. This may seem redundant, but the equal weighted indexes most often do not perform the same as their cap-weighted counterparts, and they provide a way to diversify exposure.

