Our Thrust/Trend Model (T/TM) is so-named because it treats bottoms and tops differently – tops tend to be rounded trend changes, and bottoms tend to be formed by sharp changes in direction accompanied by internal up thrusts. At price tops, T/TM changes from a buy to neutral (or sell) based upon a downside crossover of the 50-EMA in relation to the 200-EMA, evidence that a change in trend from up to down has occurred. (The T/TM for the S&P 500 is currently in neutral.) At bottoms the model uses a double screen – the PMO (Price Momentum Oscillator) crossing up through its 10-EMA, and the Percent Buy Index (PBI) crossing up through its 32-EMA.
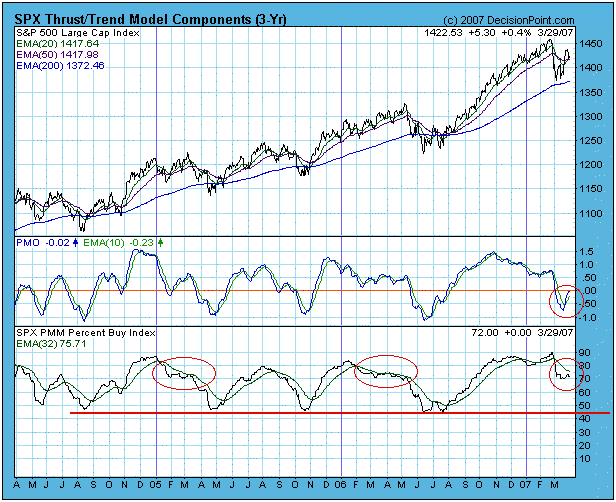
While PMO crossovers alone are useful for short-term work, there are a lot of whipsaws, so we use the additional screen of the PBI crossover to slow the model down, making it more suitable for medium-term work. On the chart below we display all the components of the T/TM. Of particular interest now are the two thrust components – the PMO and PBI. Note that the PMO upside crossover has already occurred (on the day of the giant one-day rally); however, while the PBI still remains below its 32-EMA, it has closed the gap. If the PBI does cross to the upside, the T/TM for the S&P 500 will switch to a buy signal, but my advice would be to not anticipate. Wait for it to happen.

Besides the normal need to maintain model discipline, one of the reasons for caution is that the PBI has still not dropped to the level of previous corrections. It is not absolutely necessary that it do this, but it would be a desirable sign that the correction had run a normal course and that a price bottom would not be suspect. I have drawn ellipses on the PBI in 2005 and 2006 to show the kind of PBI action we might expect.
Another concern is that the PMO looks as if it is trying to turn down below the zero line. If this were to happen, it is extremely negative for the short-term, possibly longer.
Bottom Line: We have had a number of positive events over the last few weeks, and the T/TM is close to generating a buy signal; however, there is reason to believe that the correction still has at least a few more weeks to go.
