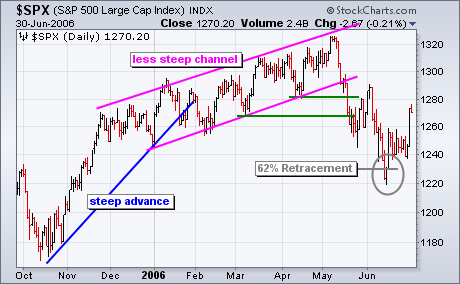
The current breakdown in the S&P 500 looks quite similar to the May-June 2006 breakdown. Let's look at the May-June 2006 break down first. The S&P 500 surged from mid October to mid December (2005) and then began a slower zigzag higher until early May (2006). Despite slowing momentum, the trend was in good shape as long as the index kept forging higher highs and higher lows. The break down started with a sharp decline and break below the April low in mid May. There was a brief reaction rally back above 1280 and then another move lower to forge the mid June low. The total decline retraced 62% of the Oct-May advance.

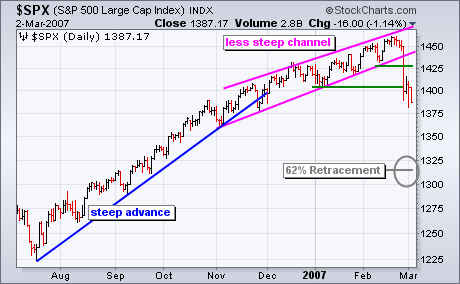
On the current S&P 500 chart, the index advanced sharply from mid July to late November and then began a slower zigzag higher from December to February. Despite slowing upside momentum, this advance was in good shape as long as the index kept forging higher highs and higher lows. With a gap down and sharp decline this week, the index broke below the February and January lows. This breaks the string of higher lows and argues for a trend reversal. At the very least, we should expect a correction. Should the index follow the May-June script, a 62% retracement of the Jul-Feb advance would target a correction to around 1314.

