In my 2/16/2007 article, Cash Flow Shows Wall of Worry, I asserted that the dearth of bullish Rydex cash flow was a sign that the rally would probably continue because the bulls were still not committing in a big way. For the sake of variety I try not to repeat a topic too soon, but I received an unusual amount of mail about this, much of it asserting that ETFs and other products are siphoning bullish funds from Rydex and other mutual fund groups. The following letter makes the point very well.
Hi Carl,
While I don't disagree with your overall opinion about the market 'climbing a wall of worry', I do think you're missing the boat regarding what the Rydex data is telling us. If you look closely at the Rydex Asset Analysis Total Bull+Bear+Sector+MM chart you will notice that total assets have been diminishing since the beginning of '06. How could this be? Well I'll tell you. I've been trading Rydex funds for over 10yrs. It's a bears den. It does not make for a valid picture of overall market sentiment during bull markets.
The reason total assets have been declining is because the funds/investors/etc. that use Rydex for bearish positioning are now bullish and allocating their assets outside of Rydex. A long time ago I realized that there is no better vehicle than Rydex to establish short positions. Where else (except other Rydex clones) can you establish a short position with a limited downside risk outside of the options markets? Thats why Rydex is the (smart) bears choice. There are however far more efficient vehicles to establish bull positions. During an extended bull market like we have right now, assets leave the Rydex funds in general. This is normal as Rydex is an expensive place to ride a long position. When (if) the market starts heading down for any extended period you will see money flow back into Rydex. The bears will be back.
The total asset data doesn't tell us where these previous assets have gone, but I assure you its generally long. That means the data is still useful because its telling us there are very few bears in this market right now . . . a dangerous (if you're long) situation for sure. Bull markets can and do continue far longer and higher than most of us can guess or even stomach. Thats their nature to flummox the disbelievers into submission, and then they're done for awhile.
I really appreciate your efforts to organize the Rydex data. I use it all the time. I do however respectfully disagree with the way you divine overall market sentiment from it. You are taking one slice of market participation (a bears den) and applying far too much importance to it, especially in an extended bull market.
Respectfully,
Tim Herbert
DecisionPoint.com Subscriber
I want to thank Tim Herbert for giving me much food for thought. I don't agree with all his points, but, after much thought and chart gazing, I believe he is correct that the migration of bull money from Rydex into ETFs and other instruments is now a significant factor, but it is a relatively recent one. In any case, it does make me have second thoughts about my conclusions in last week's article.
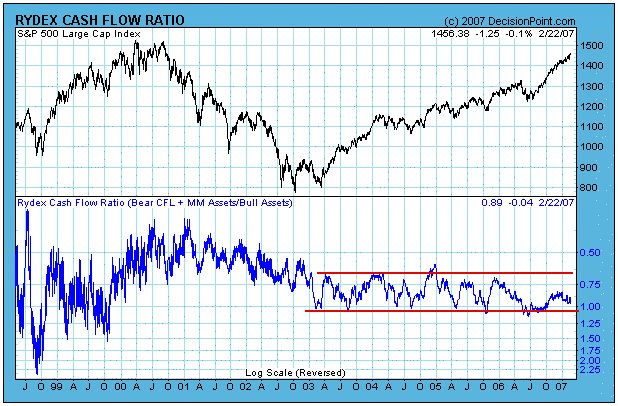
Under this new concept, we are going to have to develop new techniques to analyze the Rydex data. This will not be the first time. As you can see by the chart below, the Ratio has had three distinctive phases and ranges. In the early days the range was very wide because there were fewer assets involved in calculating the ratio. During the bear market the range narrowed, and, when the bull market began, the range shifted lower and was more regular and stable than ever before.
During the period between the beginning of 2003 to mid-2006 the Ratio was a superb measure of extremes in bullish and bearish sentiment. That it was not such a good top picker, is not a weakness that is limited to the Ratio. During bull markets, there are virtually no indicators/oscillators that can reliably identify price tops.

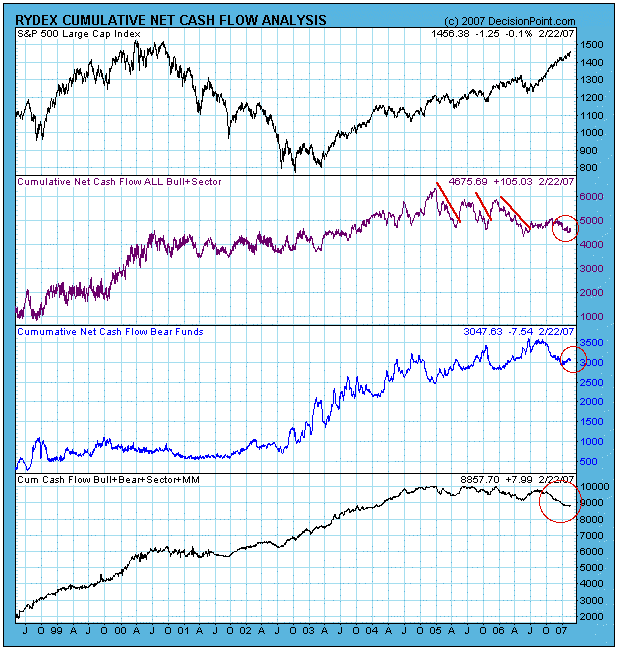
In the next chart we look at bull, bear, and total cash flow. On the Bull plus Sector panel you can see three cash flow peaks followed by cash flow declines that I have emphasized with sloping trend lines. What we are observing here is money going into bull funds, then being withdrawn during the topping process that takes up to several months. Is the withdrawal evidence of money moving into ETFs? That is not a reasonable assumption. Why would a person who is using Rydex bull/sector funds suddenly close profitable positions to open bullish ETF positions?
The first real evidence we have of Rydex bull funds being abandoned for ETFs is the period following the June/July 2006 lows. Note the absence of an upward surge in bullish cash flow associated with the rally. Last week I concluded that this was evidence of a "wall of worry", and that the bulls had not yet accepted the rally. I now believe that conclusion was wrong, and that investors are shunning Rydex bull funds in favor of ETFs. I think this conclusion is borne out by the bottom panel on the chart which shows total cash flow beginning to trend downward.

Finally, notice how in the last few months bull cash flow is declining and bear cash flow is rising. This is a similar pattern to the three prior bull cash flow peaks, albeit much smaller. As in the previous cases, I think this shift is a precursor to a correction or consolidation.
Bottom Line: The Rydex Cash Flow Ratio is probably being influenced by a significant lack of interest by investors in Rydex bull funds – ETFs now being the vehicle of choice. This shift in emphasis will necessitate our being more cautious in our interpretation of the Ratio until we can see what kind of new pattern, if any, emerges.
