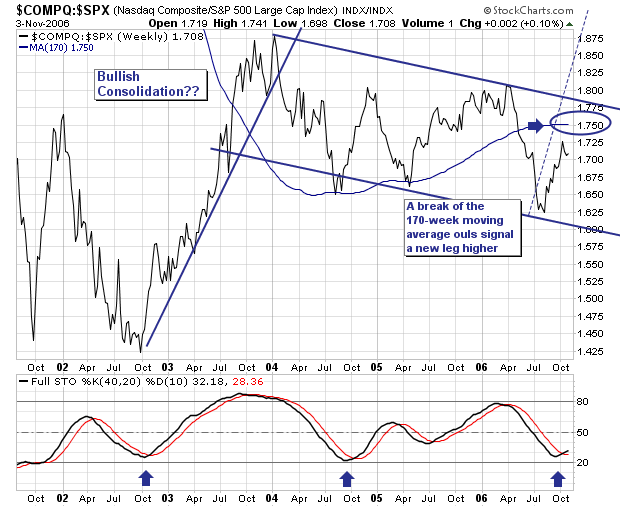
The broader market rally off the June/July lows has pushed all the major indices higher; and in particular the Nasdaq Composite has outperformed rather noticeably if one looks at the Composite/S&P 500 Ratio. It has moved from 1.625 to 1.725; not a very large move, but a relatively profitable one to those wise enough to have been overweight technology shares. In that technical vein, we cannot help but note the very long and drawn out bullish consolidation forming; one that is nearly 3-years old right now, and that will become older until a clear breakout above trendline resistance is obtained, or until it breaks down. Time will only tell. But remember, the longer consolidations take to form, the more powerful the move after the breakout. Then, and quite obviously, the first signs a breakout move was under way would be a move above the 170-week moving avearge, with confirmation coming on a break above trendline resistance. This would target a ratio level somewhere upwards of 2.07 if we use the October-2002 rally into January-2004 as a guide. Further, the time frame in which it is likely to do so is within a 12-18 months. Therefore, we are intently focused upon the 170-week moving avearge; once this occurs, then we are willing buyers of the ratio, which generally coincides with a broader Composite rally.

