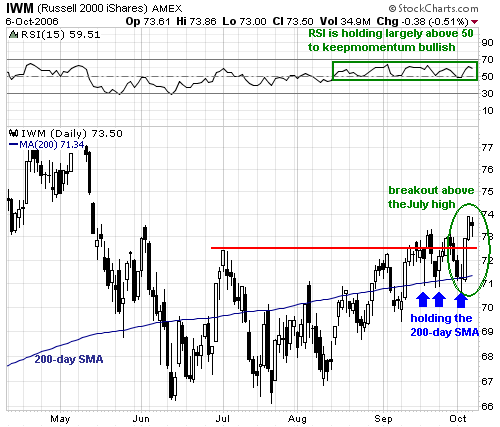
After lagging QQQQ and SPY throughout September, the Russell 2000 iShares (IWM) got into the action last week with a surge from 71 to 74 (4.2%) on Wednesday and Thursday. The ETF remains well below its May high and is still lagging over the last few months, but this October surge is a good sign for small-caps.

On the price chart, IWM broke back above the 200-day moving average in early September and held this moving average three times in the last three weeks (blue arrows). The ability to find support around 71 was followed by a break above the July high and IWM is starting to look like its old self again. Indicator-wise, RSI held support around 50 and has been trading largely above 50 since mid August to keep momentum bullish.
The bulls are in good shape as long as RSI holds above 50 and IWM holds above the last three reaction lows (blue arrows). A strong stock should hold its breakout and we should accept nothing less. The upside target would be to the May highs. Failure to hold this recent breakout and a move below last week's low at 70.68 would be bearish for IWM. For RSI, a move below the October low at 47.5 would turn momentum bearish.
