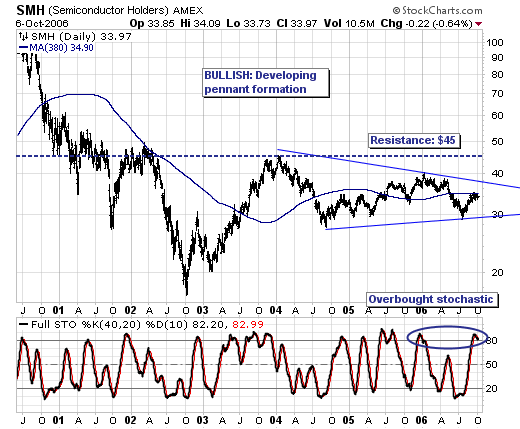
The sharp technology share rally has caught many "off-sides" to be sure. Take for example the NASDAQ 100 "Q's" +13.4% rise off their June low; this is quite impressive indeed...but not as impressive as the +19.7% gain in the Semiconductor Index (SMH). Our forecast is for the "Q's" to decline in the weeks and months ahead; thus, we are asking ourselves the question as to whether SMH will continue to perform relatively "better"...or "worse". It is a reasonable question, and one we will answer as "worse". In fact, given the past several day SMH trading action - we can now make the risk/reward case that selling short at current levels makes good trading sense.

First, let us note that we "respect" that the SMH chart has formed a very large bullish pennant pattern; it is not yet confirmed given trendline resistance has yet to be taken out, but it is certainly a sight to behold and perhaps a trade for another day. Our current focus is upon the 380-day moving average, for it has proven its merit as an "inflection point" for profitable trades. At present, price action has attempted to breakout above this level, but this overhead resistance level continues to prove is merit. This, coupled with the overbought 40-day stochastic suggests that there is further downside remaining back to the previous lows at $29.
Therefore, from a trading perspective - putting on a short position at SMH's current level of $34.29, while using a "close only" stop loss at $35.80 makes immiently good trading sense. We are risking $1.50 to return between $5 and $7; our initial trade target is between $27-$29.
