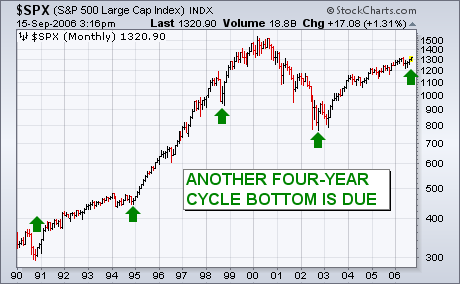
I've received a number of questions on the status of the four-year cycle. The stock market has shown a very consistent pattern of forming important bottoms every four years – usually during the fourth quarter. The last bottom took place in October 2002, which makes another one due this year. The only problem is that most of those four-year bottoms occurred after a weak year (like 1990 or 1998) or a year in which prices moved sideways (like 1994). That makes this year's action somewhat unusual. My original market outlook had been for a weaker market into October followed by a probable upturn. So far, the market has held up much better than I had anticipated over the summer months. Although the market still needs to weather the seasonally dangerous September/October months, the four-year cycle should act as a bullish prop under the market on any selloffs. The green arrows in Chart 7 show the last four cycle bottoms in 1990, 1994, 1998, and 2002. If the cycle repeats itself, another four-year bottom is due this year.

