While both the S&P 500 and Nasdaq 100 are showing the effects of the current correction, there are significant differences in the technical picture on both charts. With the S&P 500 we might ask, "Where's the bear?" The 50-EMA of price is still above the 200-EMA, and most important, price still remains within the nearly three-year rising trend channel. The most negative thing about price action is that this correction is currently making a second retest of the rising trend line, something that didn't happen on the three previous bull market corrections. Unless things change for the worse, I'd have to say that the S&P 500 remains in a bull market.
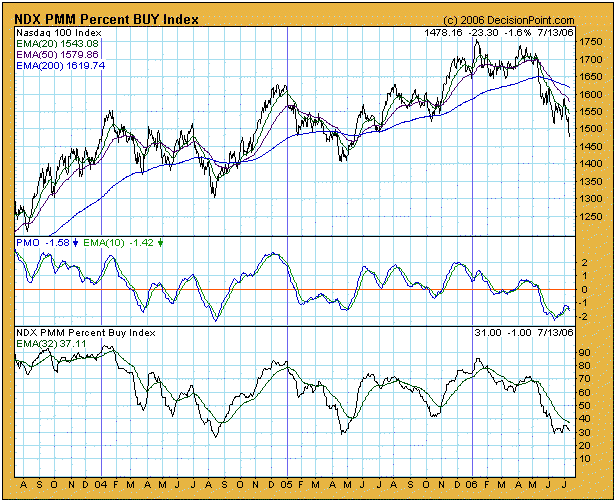
Things look a lot worse for the Nasdaq 100 Index. The 50-EMA is below the 200-EMA, and the price index has dropped down through the bottom of the rising trend channel that has defined the last few years of the bull market. I have no hesitation saying that this index has entered a bear market. This is not good because it tends to lead the broader market.


One thing that may be considered positive on both charts is that the Percent Buy Index (circled) is oversold, but, as you can see, oversold conditions do not always result in price rallies. While the Nasdaq 100 has been oversold for over a month, prices have continued to deteriorate. During that same period, the S&P 500 has held its own, but, again, the oversold condition has only brought a failed rally and second retest of support.
Bottom Line: Our market posture is neutral for both indexes based upon the status of our primary timing model. I think that's a good thing because the market could be transitioning to a bear phase. If this is the case, oversold conditions are dangerous. They can result in furious short-covering rallies that are subsequently prone to failure.
