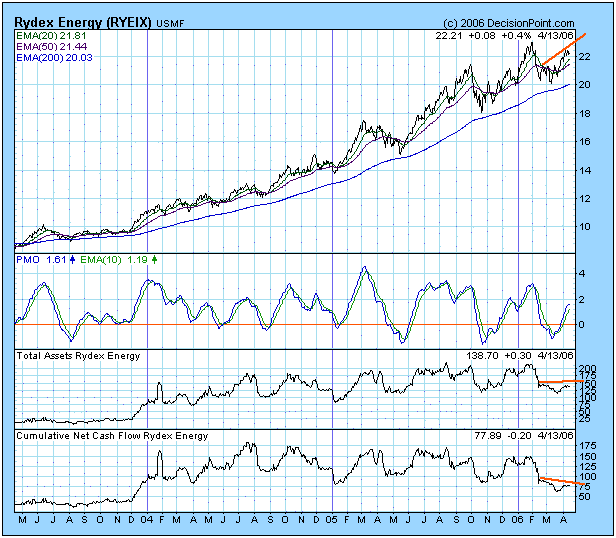
One way we can gauge sentiment regarding a particular market or sector index is by watching asset levels and/or cumulative net cash flow in and out of the related Rydex mutual fund. In general, cash flows should rise and fall along with prices. When divergences occur, price movement should be questioned. For example, a large price move accompanied by a small increase in cash flow indicates there is probably not broad support behind the price move and that the rally could fail. Or, a sharp decline that does not result in proportional cash outflows probably indicates too much optimism and the likelihood of an additional decline sufficient to cause capitulation.
In the case of Rydex Energy Fund we can observe that, as we would expect, money flowed out of the fund when prices declined from the January top. After the correction was completed, prices once more advanced toward the January high; however, this price advance was not confirmed by money flowing back into the fund. In fact, assets and cash flow have remained flat during the price advance.

How can the fund's price advance if money is not pushing the move? Remember, the fund's price is actually its NAV, which is the net asset value of the securities owned by the fund. The value of these securities will change as a result of their being traded in the market. The fact that fund asset levels and cash flow do not confirm price changes indicates that volume associated with the move is drying up. In the case of Energy Fund, we can assume that the advance is not likely to be sustained.
At DecisionPoint.com we track assets and cash flow on all 47 Rydex funds. They are invaluable sentiment indicators.
