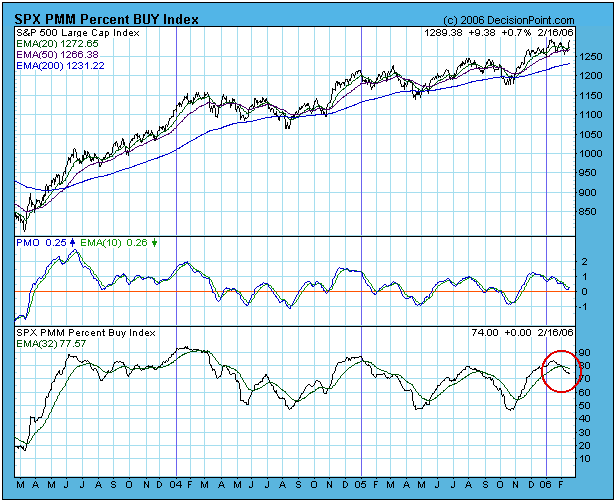
In my February 2 article I stated my belief that a medium-term correction is in progress because the PMM Percent Buy Index (PBI) has turned down and crossed down through its 32-EMA. The chart below shows this condition still exists, and I have not changed my mind at this point.

Some readers pointed out that a similar occurrence in 2003 did not have serious negative effect on prices. I agree, and I should have mentioned this in the article. There is, however, a big difference in the 2003 PBI top and those that occurred afterwards. That 2003 top occurred after a huge upward thrust of the PBI from deeply oversold levels that signaled the beginning of the bull market. The PBI has not been that deeply oversold since.
This week the market has rallied, once again challenging recent highs and straining the credibility of any bearish outlook, but in doing so it has become quite overbought in the short-term, while also approaching overhead resistance.
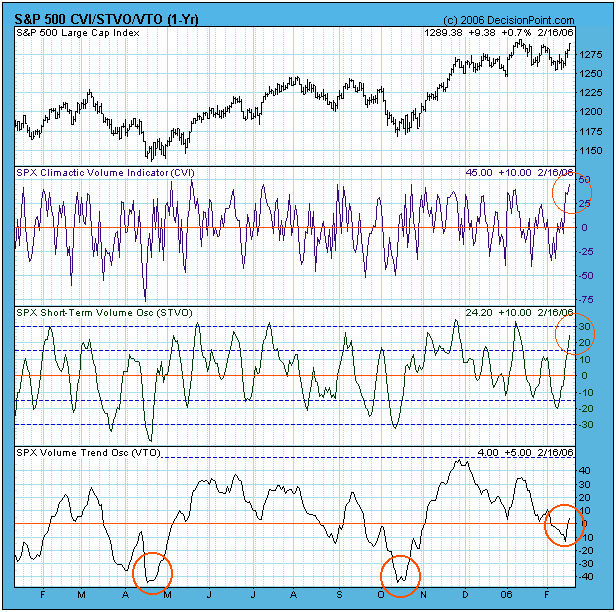
The overbought condition can be seen on the chart of our OBV Indicator Set* below. The Climactic Volume Indicator (CVI) has reached the top of its normal range, and the ST Volume Oscillator (STVO) is not far behind. These are short-term indicators.

The internal problem with the rally can be seen on the Volume Trend Oscillator (VTO), which is a medium-term indicator. Note how the rallies in April and October were launched from deeply oversold levels on the VTO, whereas the current rally launched after the VTO had only dropped to neutral levels. The same problem exists on the charts of many other medium-term indicators. While the rally may continue, its pedigree is pretty weak, and indications are that it has run out of steam short-term.
