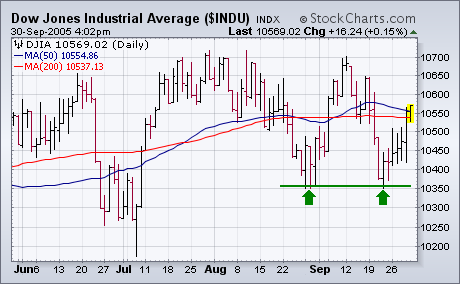
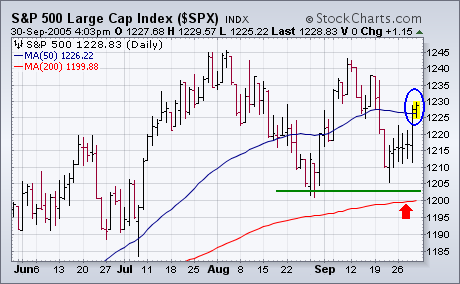
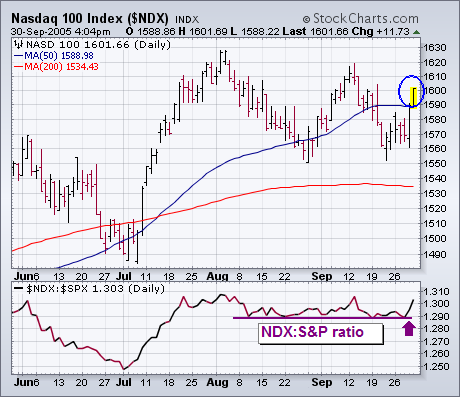
MARKET AVERAGES CLOSE BACK OVER 50-DAY LINES... The market had a lot thrown at it this month. A spike in energy prices, plunging consumer confidence, and rising long-term interest rates. It also had the month of September to deal with which has traditionally been the worst month of the year. While the market bent a bit during the month, it refused to break. And then ended the month on the upside. The first three charts show essentially the same pictures. The three major market indexes held support at their late-August lows and closed the week back over their 50-day averages. [The S&P and the Nasdaq also stayed over their 200-day averages]. That action prevented a chart breakdown and has kept the market in a trading range. This week's bounce also kept weekly and monthly indicators in positive territory. Part of Friday's market gains were probably the result of falling energy prices. Some other positive signs were new signs of strength in small caps, the Nasdaq, semiconductors, and the transports. Chart 3 plots a ratio of the Nasdaq 100 divided by the S&P 500 . The ratio peaked in early August when loss of Nasdaq leadership started to weigh on the entire market. The good news is that the ratio started to bounce again this week (see arrow). The market usually does better when the Nasdaq shows upside leadership. A lot of the Nasdaq leadership came from the semiconductors.


- John Murphy
