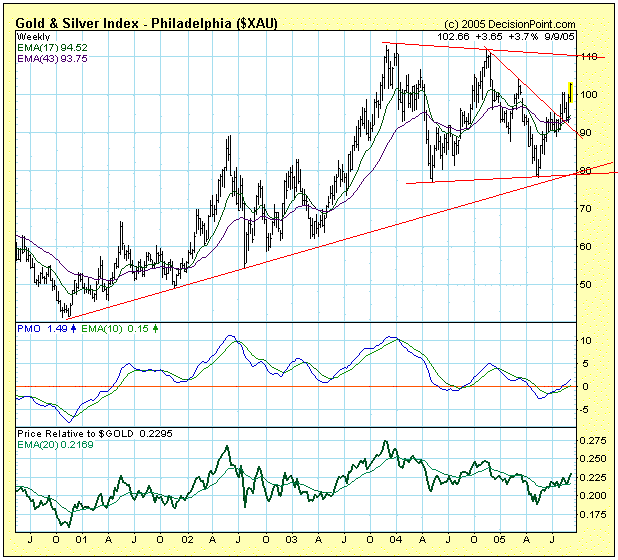
The May low for the Philadelphia Gold and Silver Index (XAU) provided us with the second data point necessary to establish the bottom of a trading range that is about two years old. The XAU is now approaching the top of the range, and we can expect that the current advance will stall when that overhead resistance is reached.
Trading ranges are also called continuation patterns. This is because they are formed when the trend of a price index pauses to consolidate before the trend continues. Since the XAU trend was rising before the consolidation began, we should expect the trend of the XAU to continue upward once the current trading range runs its course.
Our expectations regarding the trading range are also supported by the internals. The PMO (Price Momentum Oscillator) is rising and above its 10-EMA, and it has plenty of room to run before an overbought condition is reached, so the next test of resistance could ultimately result in an upside breakout.
A final note, the bottom panel of the chart shows the relative strength of the XAU to the price of gold. If gold and gold stocks always had the same percentage of change, the price relative line would be flat; but this is clearly not the case. When the line rises, it means that the XAU is stronger than gold (and vice versa). As you can see, the XAU normally moves in the same direction as gold, but at a faster rate of speed.

