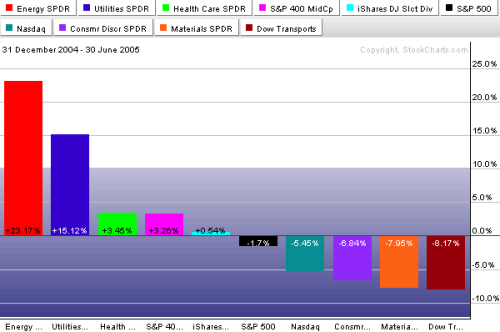
The bars in the following chart show the best and worst group performers for the first half of the year. To no one's surprise, energy was the top sector -- while the fuel-sensitive transports were the weakest. Utilities took second place thanks to falling bond yields. Another defensive group -- healthcare -- did relatively well. Midcaps did better than small and large caps. Dividend paying stocks also held up ok (as did large cap value stocks). Among the first half's weakest groups were basic materials (which include cyclical stocks), consumer discretionary , and the technology-dominated Nasdaq . The relative strength bars paint a picture of a defensive market that's being hurt by rising energy prices. If the second half of the year is going to be any better, the first half laggards are going to have to do better. And it's hard to imagine a strong market as long as energy remains in a leadership position.

It wasn't a good first half, but it wasn't terrible either. All the major stock indexes ended in the red but not by much. The S&P 500 lost -1.7%, the Dow -4.7%, and the Nasdaq -5.4%. Bonds gained more than 5% to outpace stocks. The dollar gained 10% while commodities gained a respectable 5%. The rising dollar made U.S. assets preferable to foreign assets during the first six months of the year. Of course, it's easy to spot winners in hindsight. And there's no guarantee that the first half trends will continue. One important lesson from the first half results, however, is that there are always winning groups -- even in a weak market. Our job in the next six months will be to pick second half winners and avoid losers -- no matter which direction the market takes.
